
I haven’t really looked into any tax issues since about 2010, when I was doing a bit of research on the flat-taxers that emerged in the 2000-2010 period.
January 17, 2010: The Futility of Raising Taxes
Tax policy in the U.S. has been a locus of fairly intense discussion since the 1970s, so I figured that it was something that was already taken care of.
Nevertheless, I got into a discussion about U.S. tax policy recently, and realized that my memory of these issues was rather rusty. So, I thought I’d look into a few issues in U.S. tax history. Maybe you could say this is a personal refreser, but I think it would also be helpful to others who are not so familiar with these things.
Our information today comes primarily from here:
http://taxpolicycenter.org/taxfacts/index.cfm
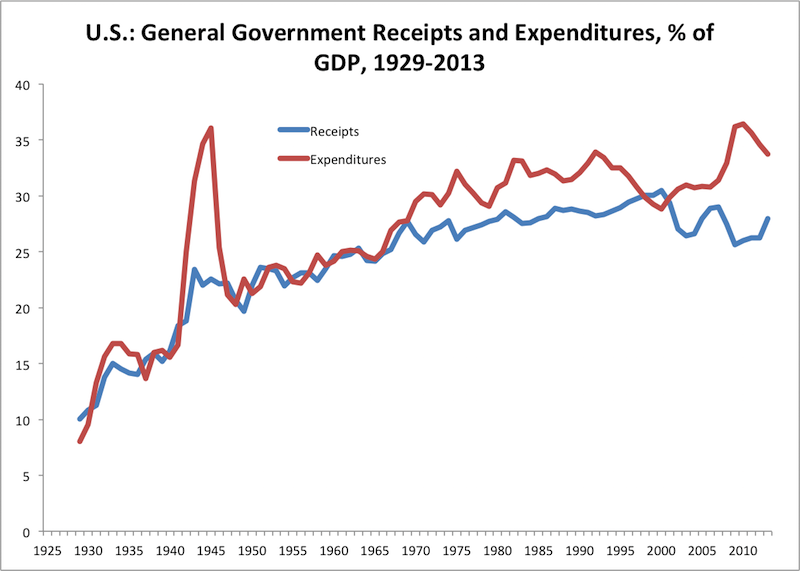
Here’s what it looks like since 1929. This is all levels of the government, Federal, state and local. We see a gentle upward trend from 1950 to 2000, and what looks like the beginnings of a downward trend since 2000. We can see here that there was no meaningful falloff in overall tax revenue after either the 1964, 1983, 1986, 1997 or 2003 tax reforms, which involved lower tax rates. Nor was there any meaningful rise after the tax increase of 1969, the bracket creep of the 1970s, or the tax rate increases of 1990 or 1994. Much of the variation here appears to be cyclical, most obviously in the 2001 and 2009 recessions, with smaller dropoffs in the 1982 and 1991 recessions.
On the General Government basis, we can also see that any deficits were basically the result of higher spending, not lower revenue; and that the disappearance of the deficits around 2000 were due to lower spending, plus a little higher revenue which made a momentary peak (due primarily to capital gains related to the 1997-2000 stock bubble).
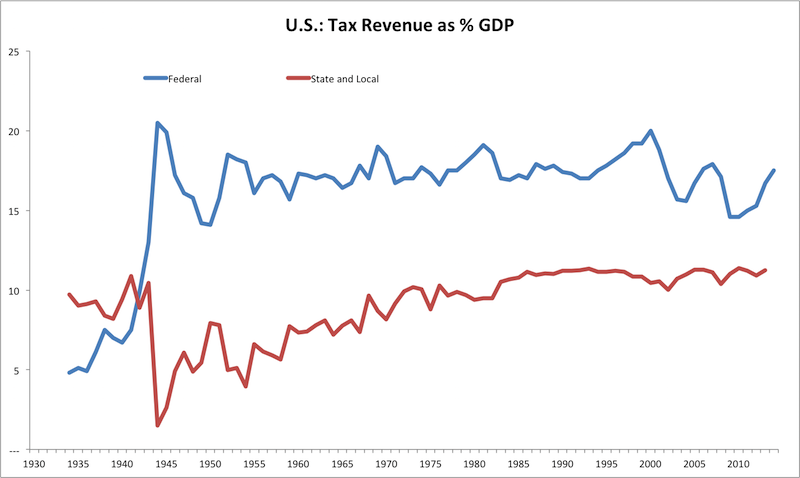
Here’s the breakdown between Federal tax revenue and state and local revenue. The Federal revenue has been quite flat, with the variation again primarily associated with recession and expansion, not tax policy. The state and local revenue, however, has risen considerably. Both have had a falloff since 2000.
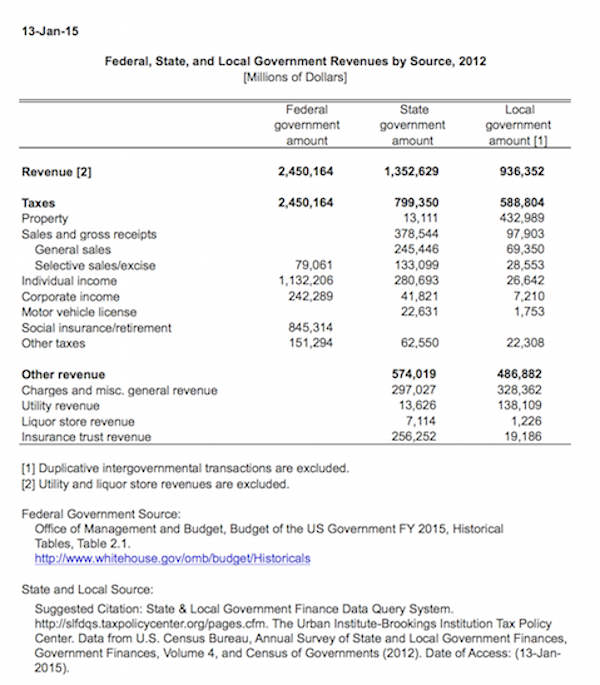
Here’s what it looked like in 2012. Unfortunately, I don’t have data here on state and local revenue sources going back to the 1950s. I think that sales taxes have gone up a lot, as perhaps property taxes have as well.
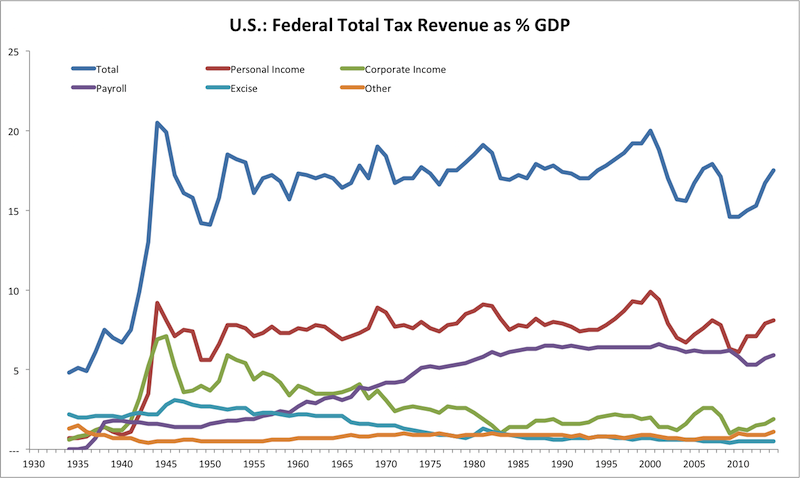
Here’s the breakdown on Federal tax revenues. The overall pattern has been very flat since about 1950, with some variation associated with recession and expansion. There isn’t much change related to tax policy. The falloffs in revenue since 2000 are something of a new phenomenon.
We see also that the Individual Income Tax revenue has been quite flat, despite a wide range of policies ranging from the 91% top rate of 1950 to the 28% top rate of 1988, exemptions high or low, and various tax brackets.
Here’s a long description of all tax brackets and rates 1945-2013:
http://taxpolicycenter.org/taxfacts/Content/PDF/individual_rates.pdf
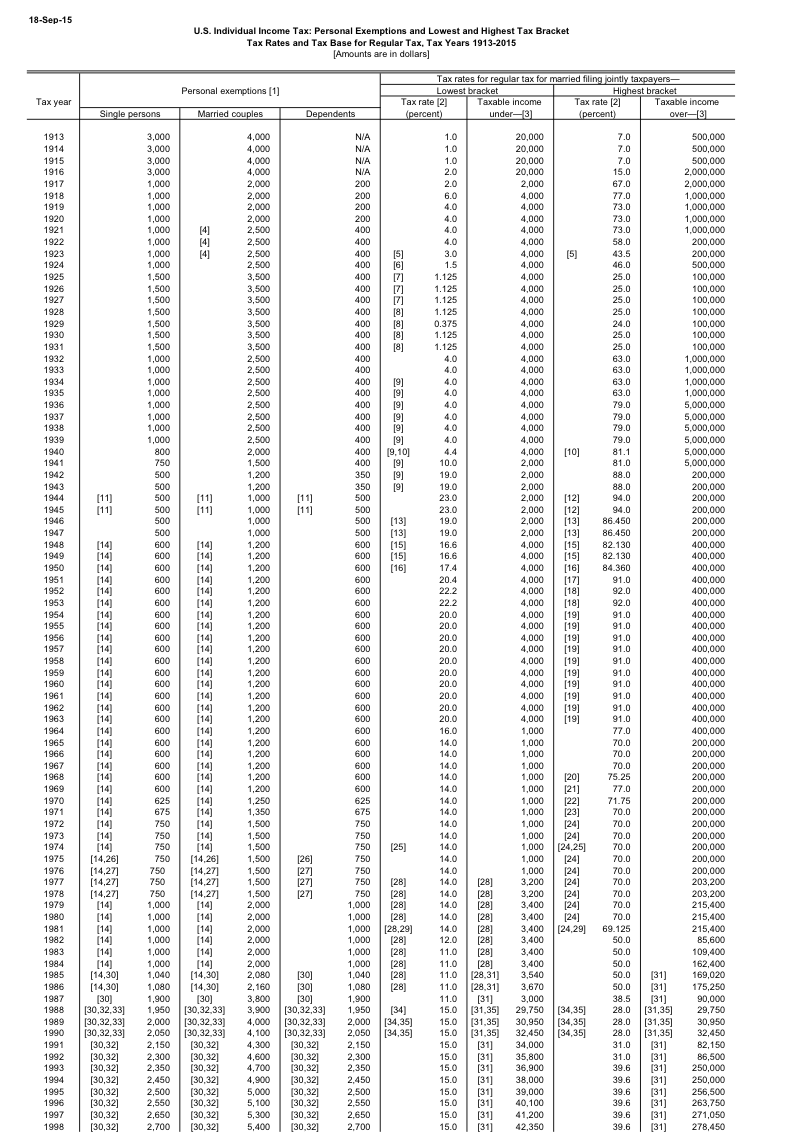
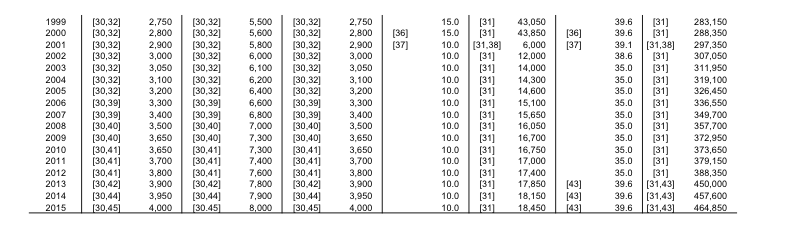
http://taxpolicycenter.org/taxfacts/Content/PDF/historical_parameters.pdf
A few interesting things: look at the huge bracket adjustment of 1988. The brackets didn’t move in the 1970s despite inflation, so people were paying high taxes on lower and lower income. The 1988 adjustment corrected this, and also introduced inflation-indexing of tax brackets. The bracket adjustment made no difference in tax revenue, as we have seen.
The Corporate income tax revenue/GDP, however, has had quite a lot of change, from levels above 5% in the 1950s to levels around 2% today. At the same time, revenue from Payroll taxes have risen enormously, along with payroll tax rates. Excise and “other” taxes were more significant in the past, and have declined. This probably includes tariffs.
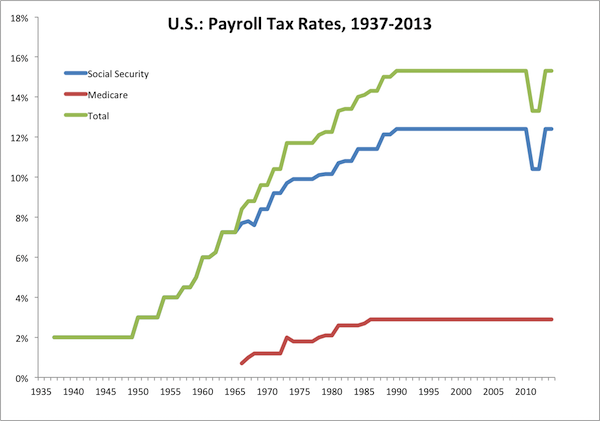
Here’s what the payroll tax rates look like. The total is 50% paid by employees and 50% paid by employers. The dip in 2009-2010 reflects a temporary tax reduction during that time in response to a recession.
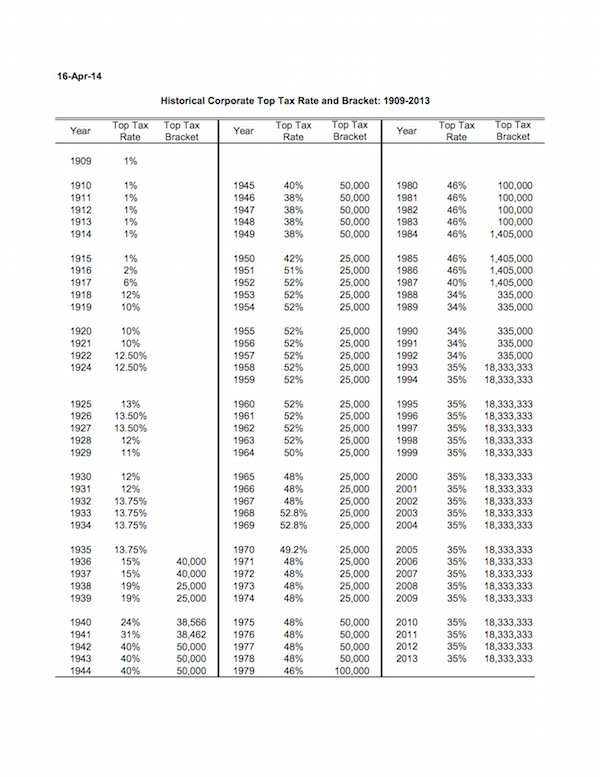
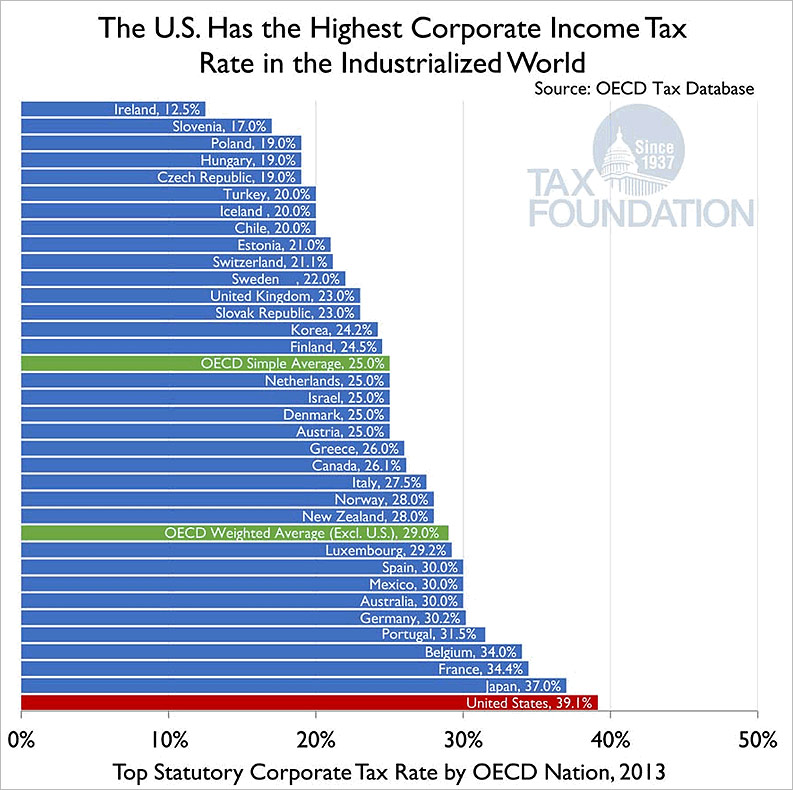
Here’s a history of nominal corporate tax rates in the U.S. This does not include state-level taxes, which are now around 5%, for a total of around 39.1%, which is now the highest corporate tax rate in the developed world. I suspect that state level taxes were lower in the past.
The most significant change in corporate tax rates was in 1987-1988, part of that tax reform. However, note that the big falloffs in corporate tax revenue actually take place long before this, and had fallen to a low level by 1980.
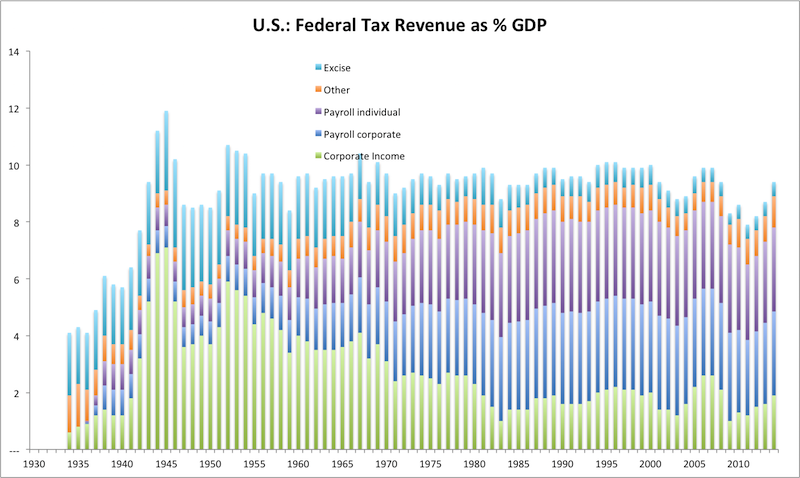
This is a look at Federal tax revenues, omitting for now the Individual Income Tax. Also, it is in a “cumulative” style rather than overlaid. On the bottom we see the large decline in corporate tax revenue, from levels above 5% to below 2%. We see no change at all due to the 1987-1988 reduction in tax rates, indeed there is a small rise afterwards.
I am intrigued that the falloff in corporate tax revenue was accompanied by a rise in payroll tax revenue, such that the two somewhat cancel out. Since the payroll tax is 50% paid by corporations, it could be called a sort of corporate tax. Anyway, the corporations write the checks to the IRS. We have already seen that Individual income tax revenues have been very stable for 60+ years. Apparently, individuals have an opinion of how much they want to pay the Federal government, and they pay that much and no more. Maybe the same is true for corporations, and why not since corporations are run by individuals too. Maybe corporate managements also have a sense of how much they want to pay the government, via both payroll and income taxes, and they pay that much and no more. I’m not saying that this is a topic of discussion at board meetings, just as it is not a topic of discussion among families. It just works out that way. The combined corporate income and corporate-paid payroll taxes is the combo of the bottom two divisions in this chart. It suggests that you could eliminate the payroll tax — all of it! — and generate about the same amount of revenue, with the deficit being filled by the corporate tax. But, this is really a sort of goofy hypothesis on my part.
Here’s an odd table, that I cooked up:
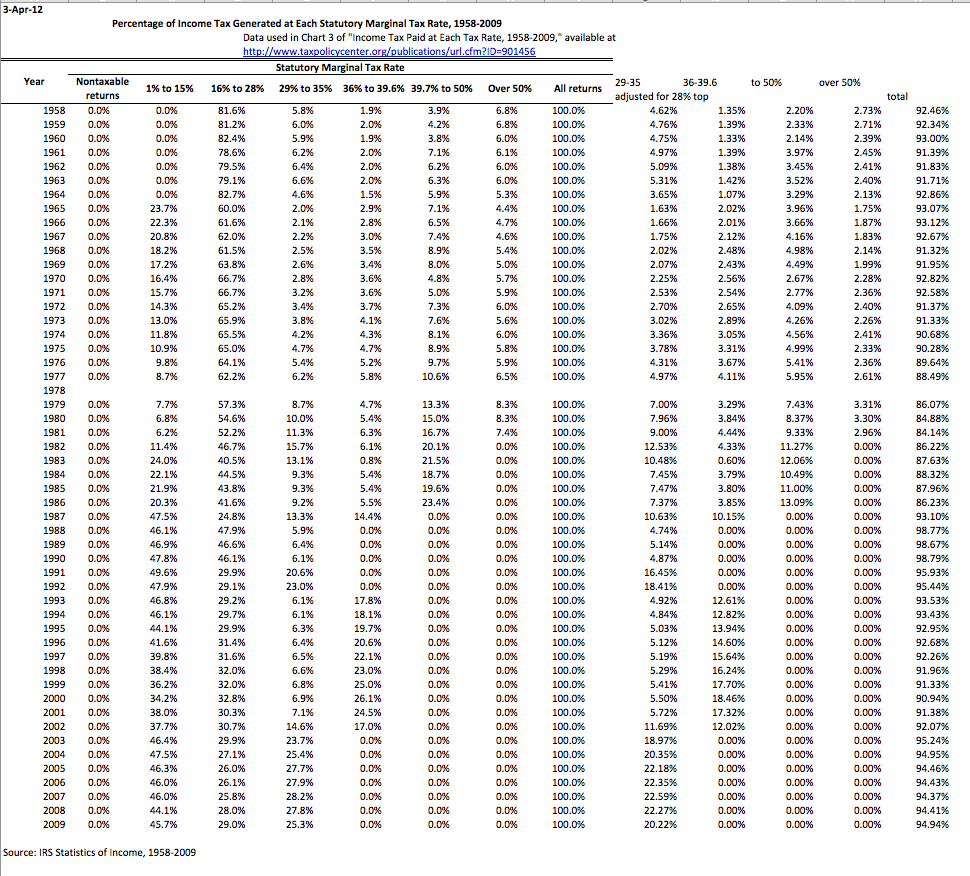
This table shows how much revenue came from various tax brackets through history. We see that, for example, 81% of all tax revenue came from brackets of 28% and below, even in the “high tax” 1950s, when the top rate was 91%. Those very high tax rates were never an important source of revenue. I adjusted these numbers to illustrate what it might have looked like if the top tax rate was 28%, as it was in 1988. For example, I take the “39.7 to 50%” revenue bracket, and assume that it was taxed at 28% rather than 50%. This is done by simply multiplying by 28/50. For the “above 50%” range, I use 70%. Then, I total it all up. For 1958, for example, we find that you would get 92.46% of the revenue by having a 28% top rate instead of 91%. This makes a lot of static assumptions, of course; in reality, what would happen is that people would engage in more taxable activity at 28% than 91%, so you would have more tax revenue/GDP than the results of these static assumptions.
But more importantly, you would have a much healthier economy. Although various tax rates haven’t affected revenue/GDP much, they definitely affect GDP as a whole. So, if you have the same revenue/GDP with a better tax system, but GDP is more than it would be under a poor tax system, then overall revenues are obviously higher — which can be used to pay for various social programs if desired. Also, since the economy is much healthier, you have more employment and also rising wages, which in itself eliminates a lot of social issues. Thus, spending on social programs can decline. The total spending/GDP can decline, which can lead to further tax reductions such that we could bring the total goverment (Federal, state, local) revenue/GDP from around 27-28% to somewhere under 20%. This would allow, for example, the total elimination of payroll taxes, among other such options. You might even find that corporate tax revenues rise as corporate-paid payroll taxes decline, the opposite of the trend since the 1950s.
The various flat-tax proposals around today are designed — on a “static basis” — to create the same amount of revenue as the existing income tax system. The rates are typically around 18%-19%, and include a rather generous basic deductible. Since these proposals are designed to create the same amount of revenue, and we observe that actual revenue has been about as flat as any economic series can be even with wildly different tax policies, it is a reasonable assumption that the intended flat revenue/GDP would indeed result. The 18%-19% rates would also apply to corporations.
I don’t agree with the notion that “corporations don’t really pay taxes, people do.” Actually, corporations do pay taxes. The indirect payers of these taxes is of course the corporation’s shareholders, not some nebulous “people”. Corporate tax rates and top individual tax rates should really be in line with each other.
The introduction of corporate income taxation also has a major effect on the capital structure, particularly debt financing since interest is expensed. I would definitely consider taxing on the basis of EBIT, before payment of interest on debt. This would eliminate that distortion between equity and debt. Dividends are paid after-tax on the corporate level, so they should not be taxed on the individual level. If debt interest was after-tax, then it would be taxed on the corporate level, and should not be taxed on the individual level.
One interesting outcome of taxing profits before interest payments is that debt financing becomes rather unattractive. If you want a predictable income something like a bond, why not just use something like preferred stock, with a fixed dividend, which would then not have any tax disadvantages? It would also make the present debt-based banking system obsolete. Instead, banks and other banklike structures could be essentially equity-financed, with a variety of interesting implications.
