Updating Our Commodity Charts
May 8, 2011
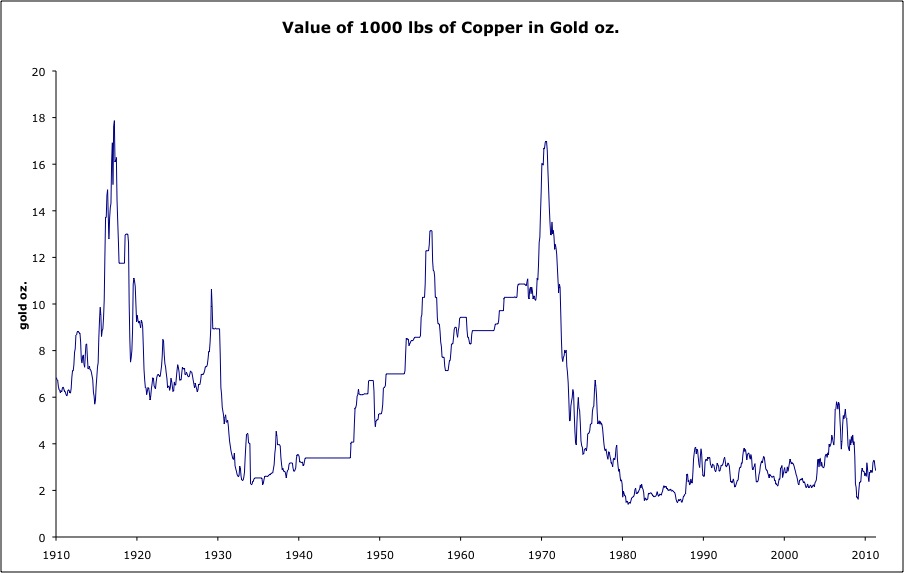
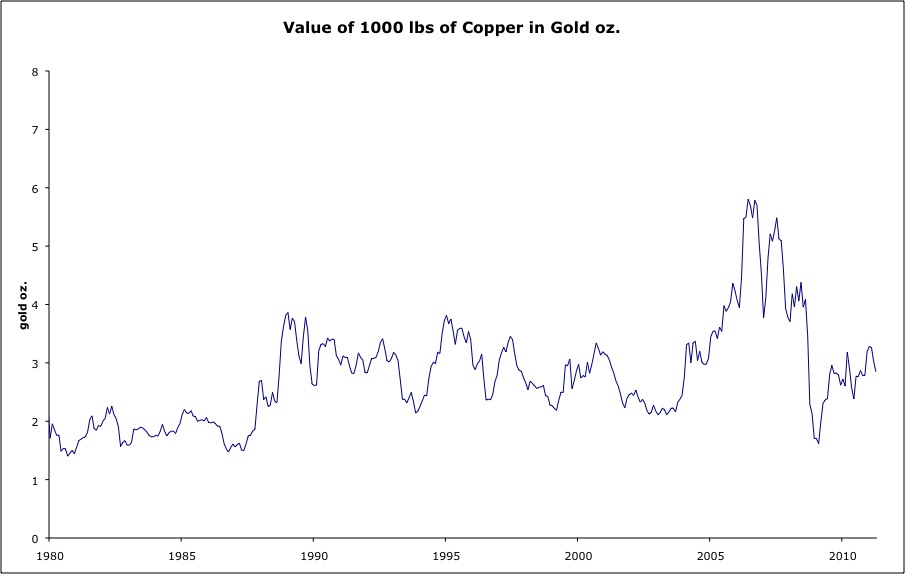
Let’s see what has been going on in the commodity markets. These charts are the “prices” of commodities in gold, the universal stable currency, rather than the dollar, which is a floating currency. If you like, you can think of it as prices in terms of “1854 dollars.” From 1789-1932, a $20 coin had about 1 troy oz. of gold.
1854 $20 gold coin, containing 0.97 oz. of gold ($20.67/oz.)
1922 $20 gold coin, containing 0.97 oz. of gold ($20.67/oz.)
Obverse of 1922 $20 gold coin.
April 15, 2007: The Value of Today’s Dollars in 1854 Dollars
These graphs show monthly average gold values and monthly closing prices, updated to the end of April.
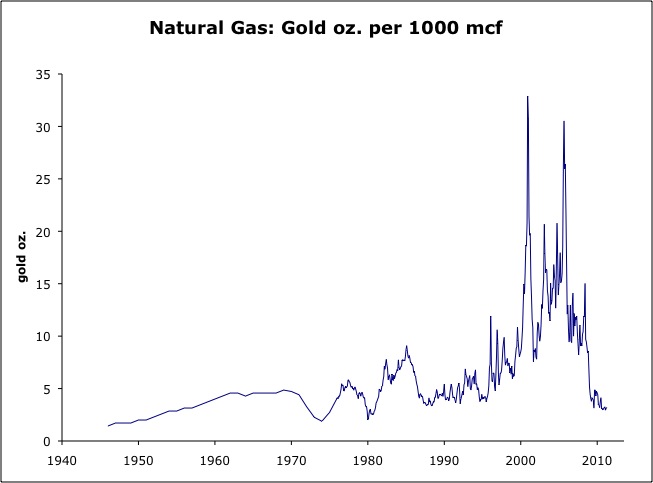
Natural gas is real cheap.
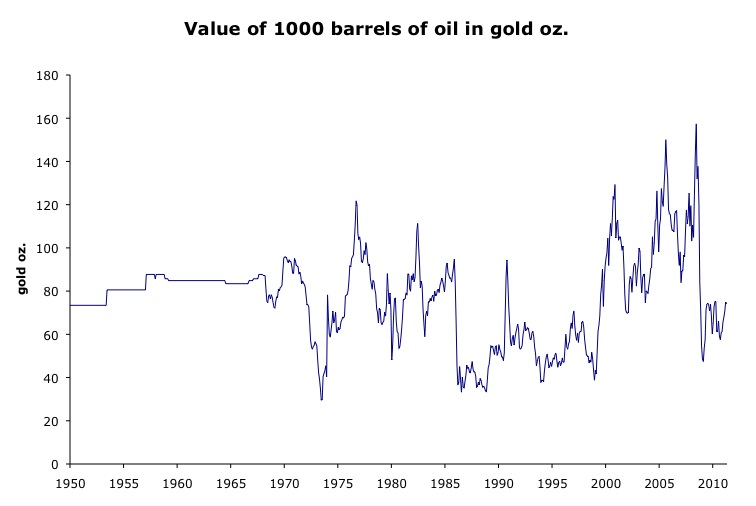
Crude oil is not super-cheap, but it is not real expensive either. It is cheaper today than in the 1960s. I think supply issues (“Peak Oil”) will be a factor going forward over the next ten years.
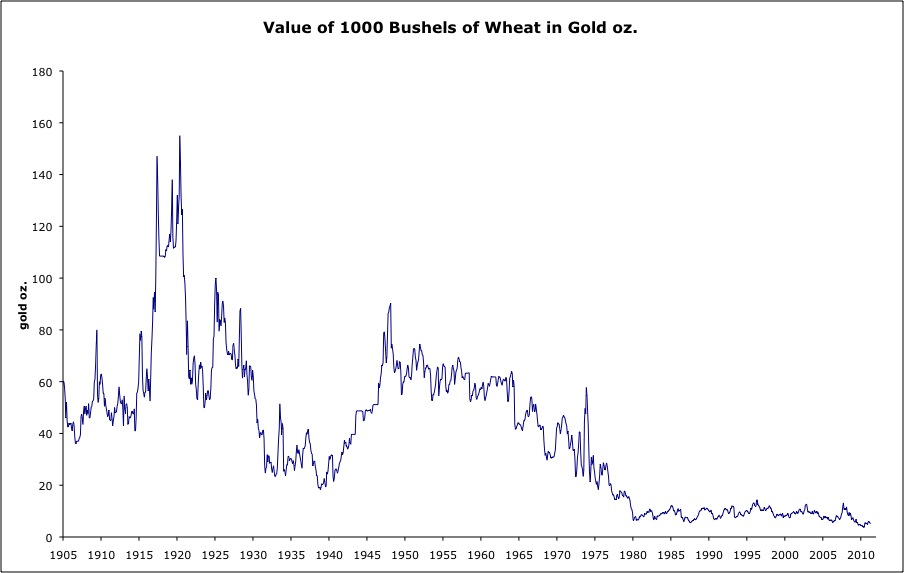
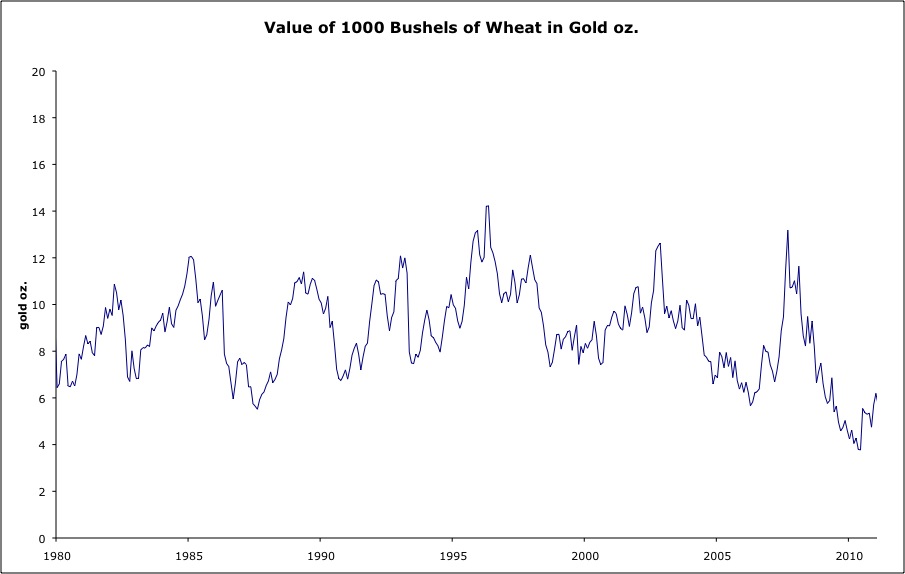
Wheat is still cheap.
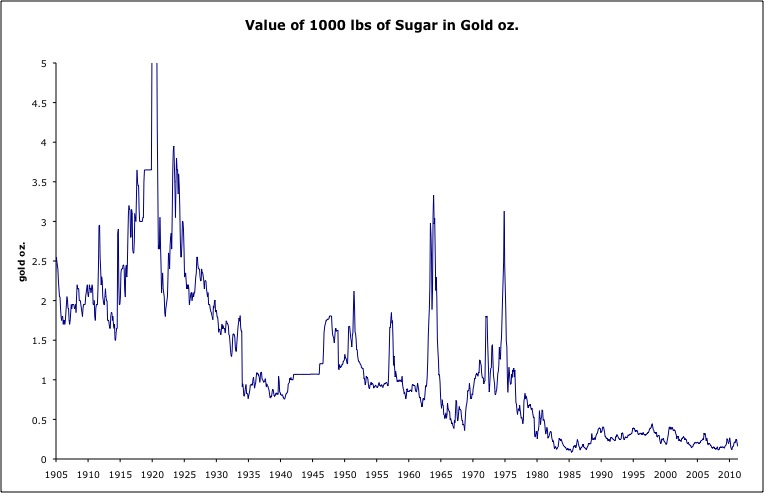
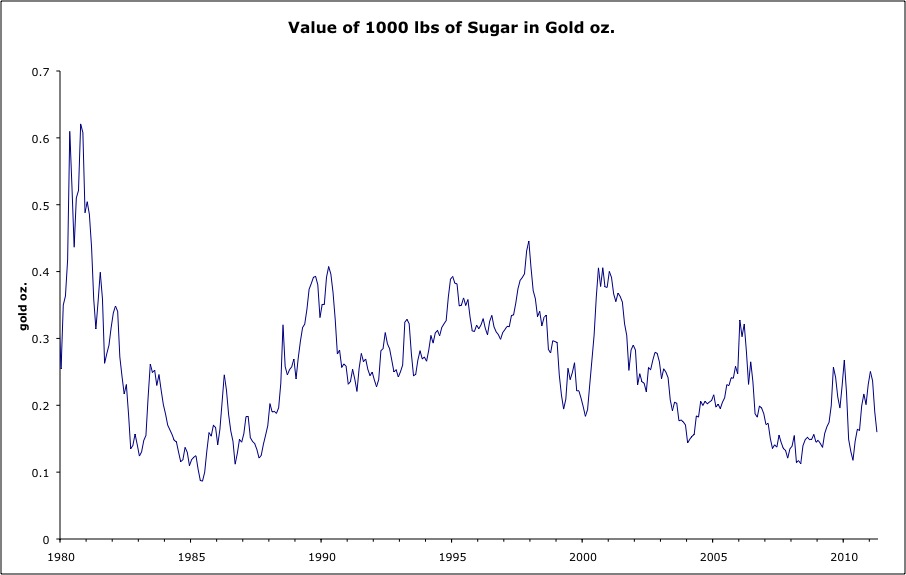
Sugar tends to be something of a speculative plaything. Lottery tickets are still cheap in sugar.
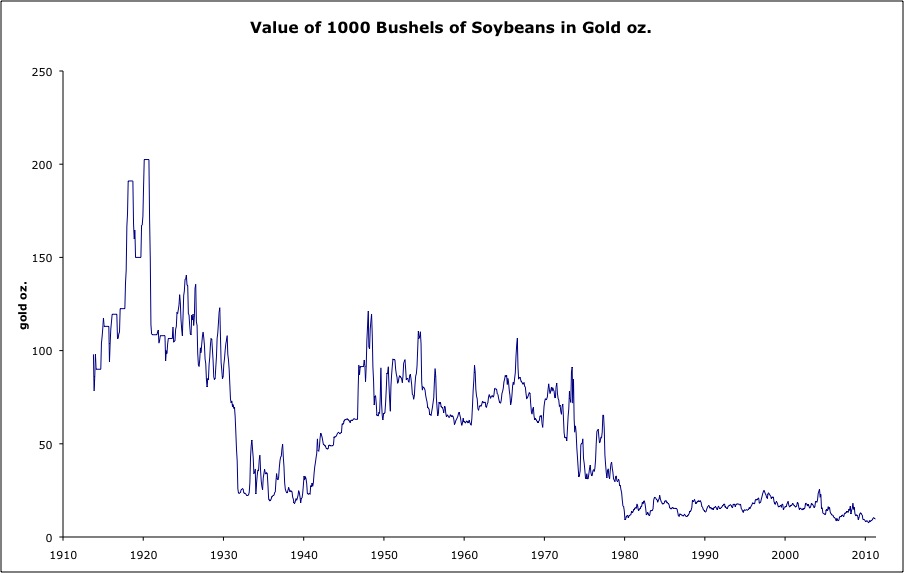
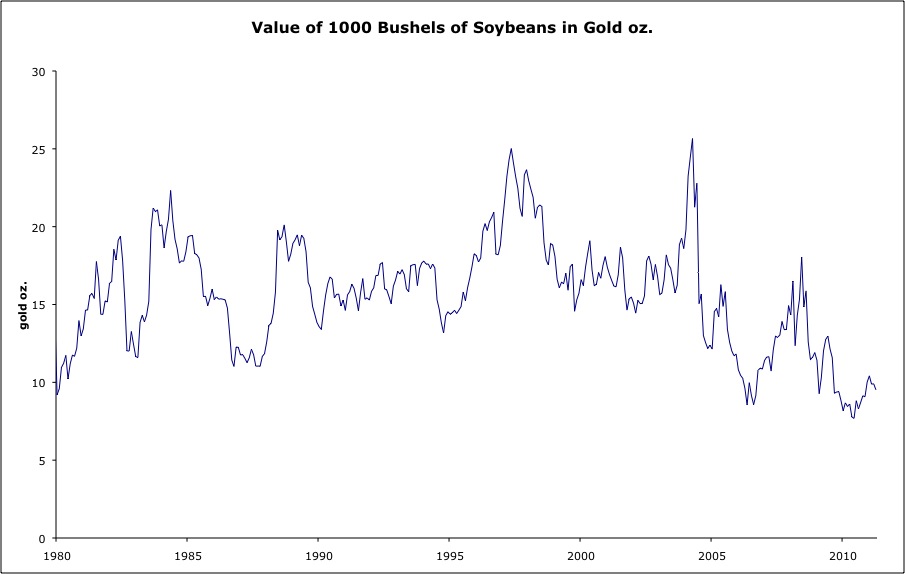
Like wheat, beans are way down there.
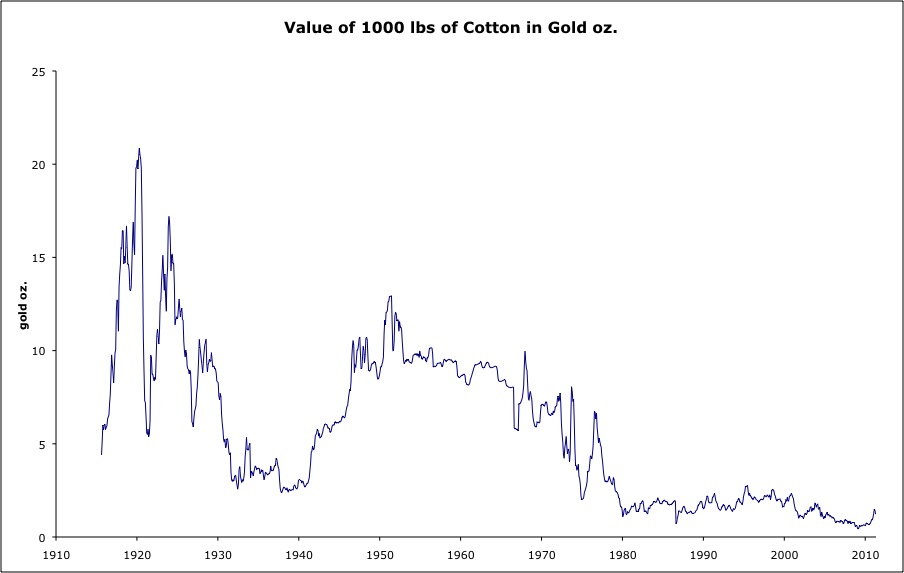
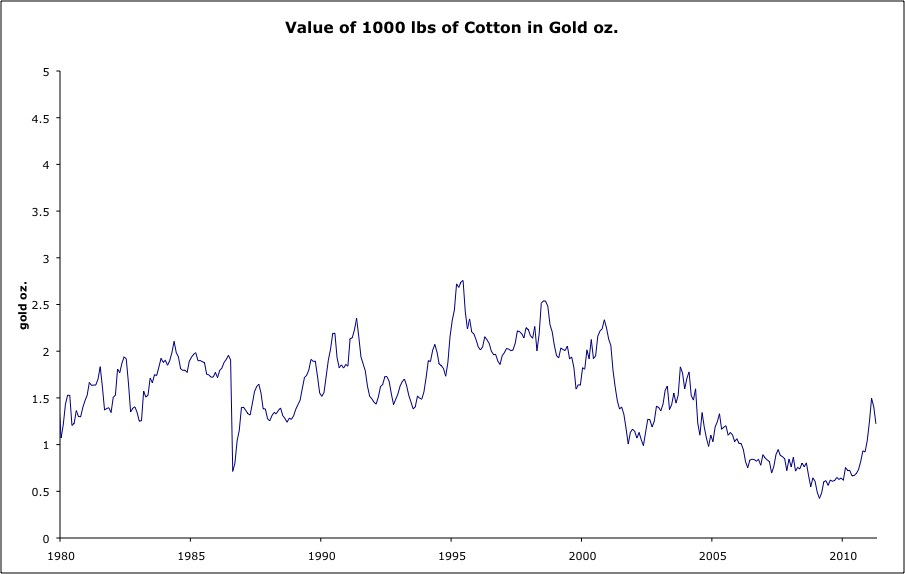
Cotton has already had a big recovery off all-time lows, but it is well within its range of recent decades.
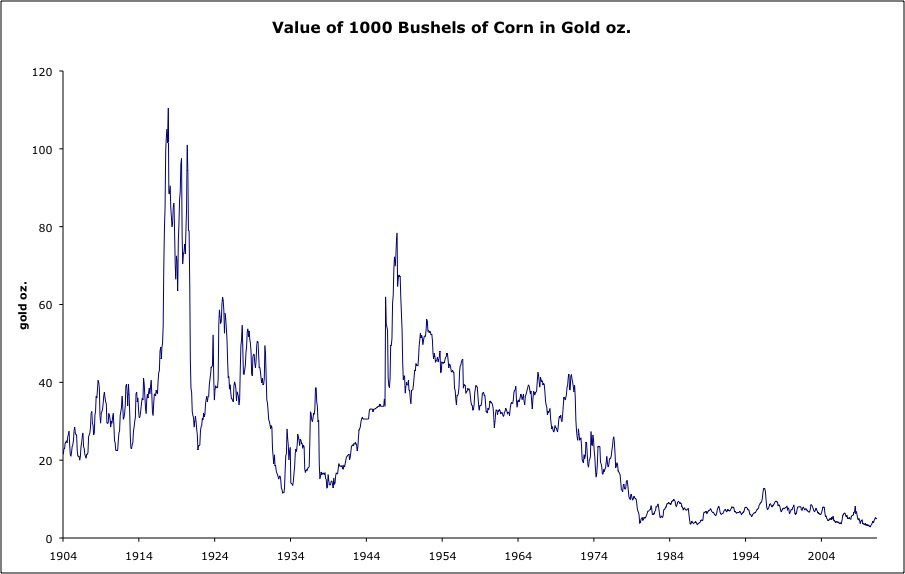
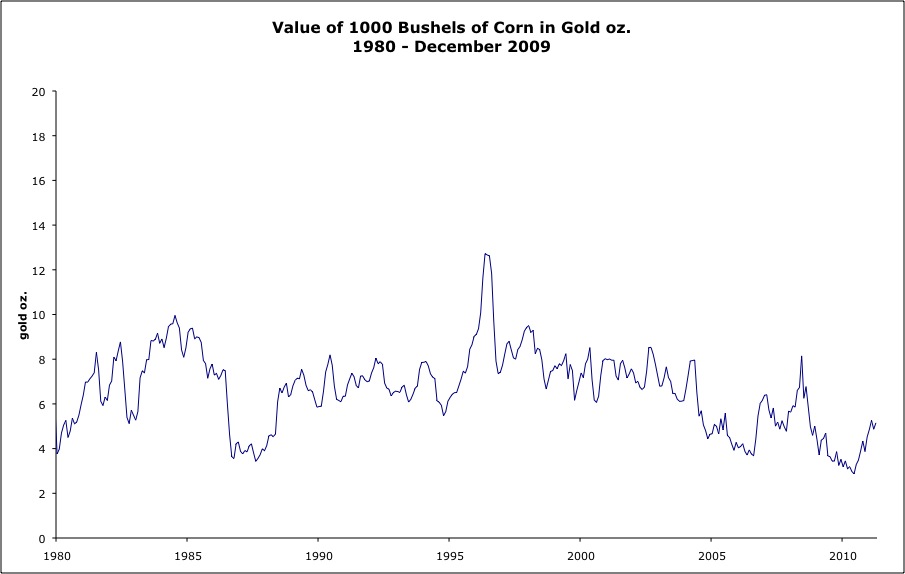
Corn is also well off its lows, but within its historical range. In general, the agricultural commodities are having supply issues as well, having to do with chaotic weather.
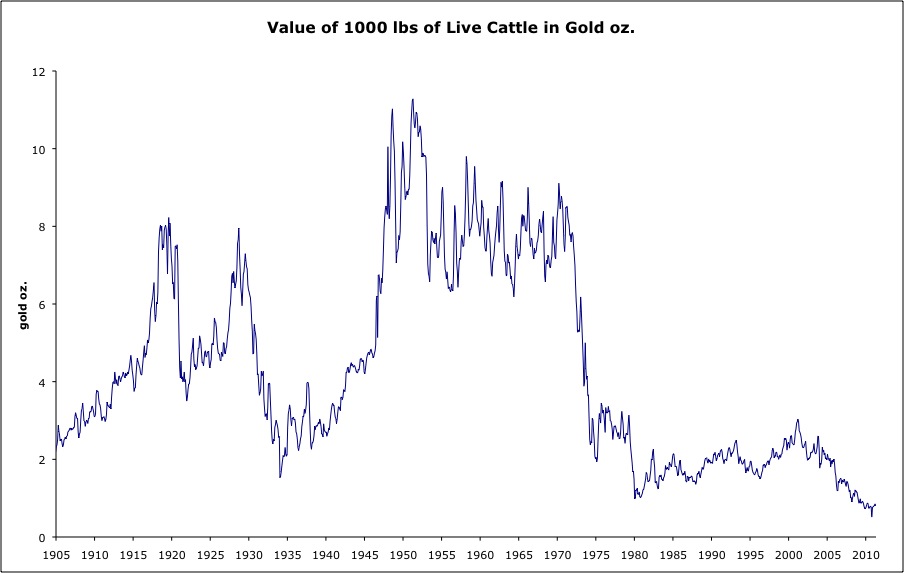
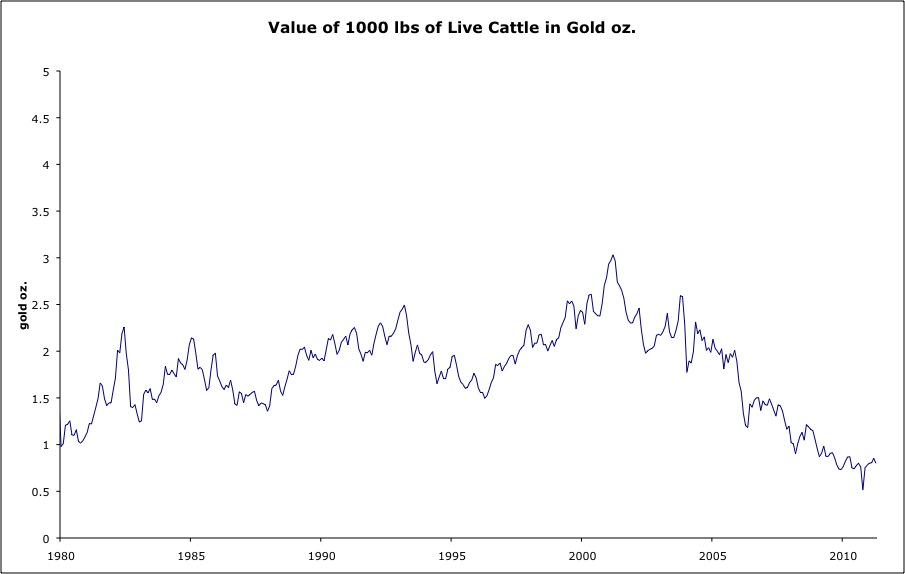
Cattle is way down there.
Copper is at a middling value here.