
We’ve looked into central bank balance sheet construction as a function of the “demand for money,” with this “demand” basically taking two forms: banknotes and coins, among the general public, and bank reserves (deposits at the Federal Reserve), among banks.
It is fairly easy to see that the public holds exactly the amount of banknotes that it wishes, and no more. At any time, if people wanted to hold more banknotes, they could go to their ATM machine and get more. Since bank deposits are much larger than banknotes outstanding, in general it is very easy to acquire more banknotes. Conversely, if people hold more banknotes than they would like, they would deposit them in banks. If banks ended up with a consistent oversupply of banknotes — pallets and pallets of banknotes that nobody wanted — they would trade them with the Fed/Treasury for bank reserves. Thus, the total base money=(bank reserves)+(notes and coins) is a fixed number determined by the Federal Reserve, but the mix is determined by private behavior.
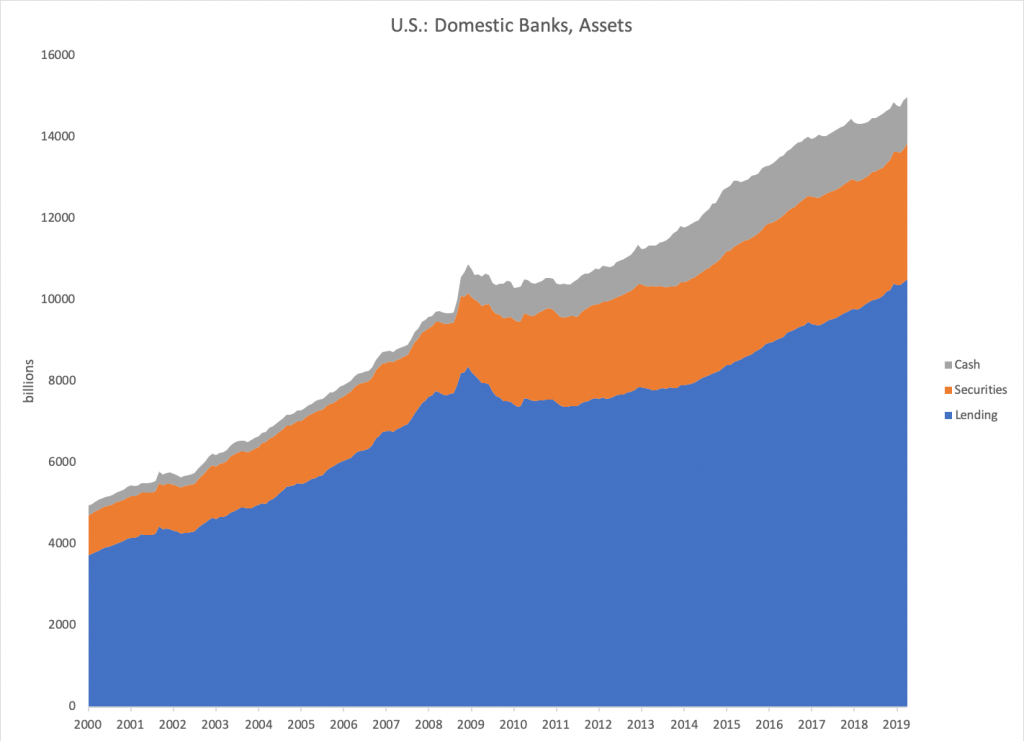
I have characterized the increase in bank reserves since 2008 as a matter of banks wanting to hold more reserves. This is why this very large increase in supply was not met with a very large decline in the value of the currency, which comes about when supply is in excess of demand. Broadly speaking, this supply met increased demand from banks to hold reserves on their balance sheets. This basically represented a return to “1950s-style” norms in banking, where bank reserves would be about 10% of total assets. For U.S. domestic banks, the ratio is about 8% today.
May 26, 2019: The Federal Reserve and Bank Reserves
June 2, 2019: The Federal Reserve and Bank Reserves #2: What’s Old Is New Again
June 9, 2019: The Federal Reserve and Bank Reserves #3: Mission Accomplished

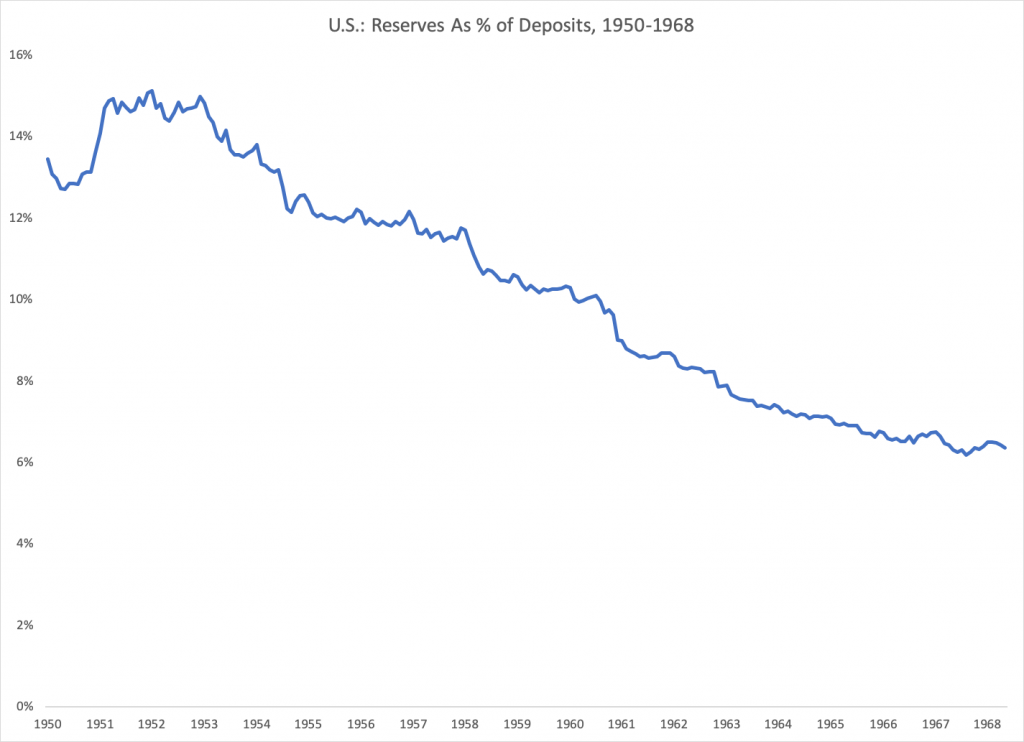
Deposits were about 90% of assets in those days, so an 11% reserve/deposit ratio translates to about a 10% reserve/asset ratio.
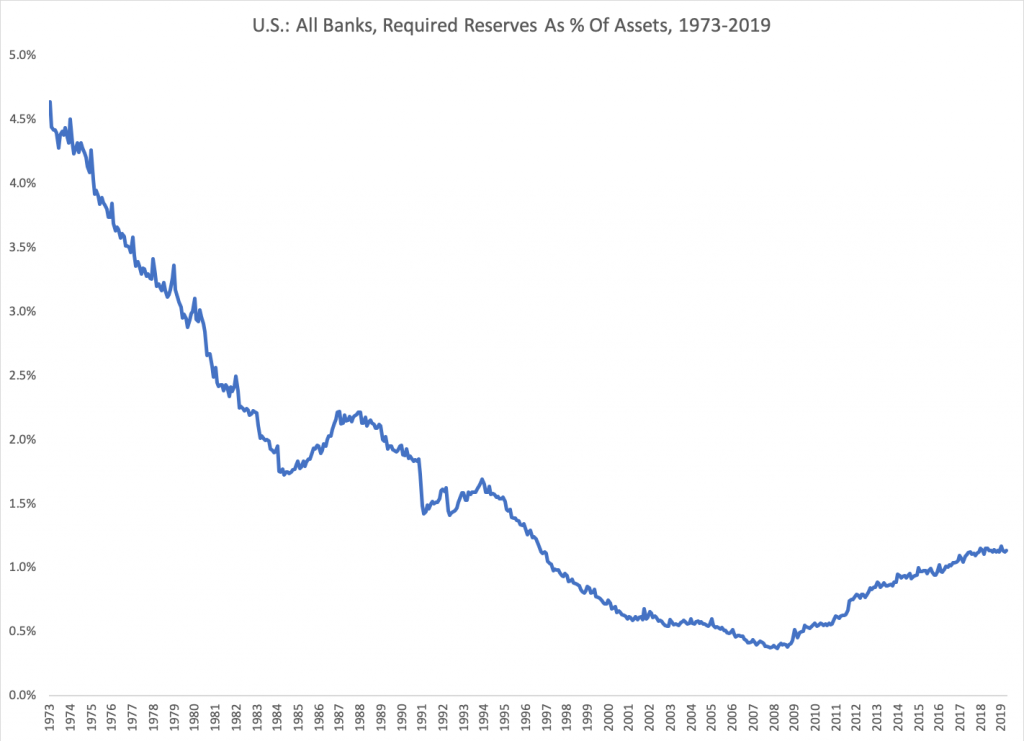
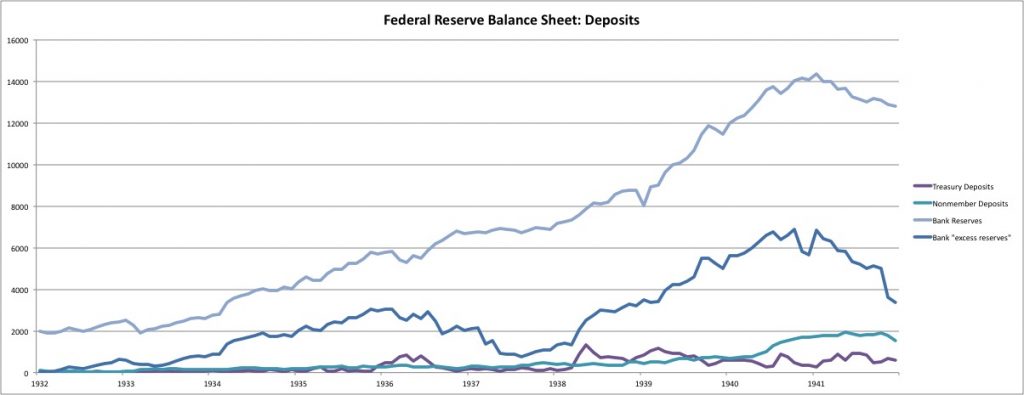
This increase in reserve demand among banks makes sense from a business perspective, independent of regulation (for example, the very large holdings of bank reserves in the 1930s, far in excess of regulations), but it has also been reflected in regulation. Federal Reserve reserve requirements haven’t changed much, and are still very, very low. However, Basel III requirements have changed a lot. Basel III was agreed on in November 2010, when the 2008-2009 crisis was acutely remembered. In general, I like the return to “1950s-style” reserve holding patterns among banks, so I am also broadly in favor of the Basel III changes.
June 18, 2017: The “Gold Sterilization” of 1937
June 25, 2017: The “Gold Sterilization” of 1937 #2: Fumbling and Bumbling
July 9, 2017: The “Gold Sterilization” of 1937 #3: The View From 2011
The Basel III requirements have two aspects, the “Liquidity Coverage Ratio” or LCR, and the “Net Stable Funding Ratio” or NSFR. They are complicated. Here is the guideline of how the LCR is computed:
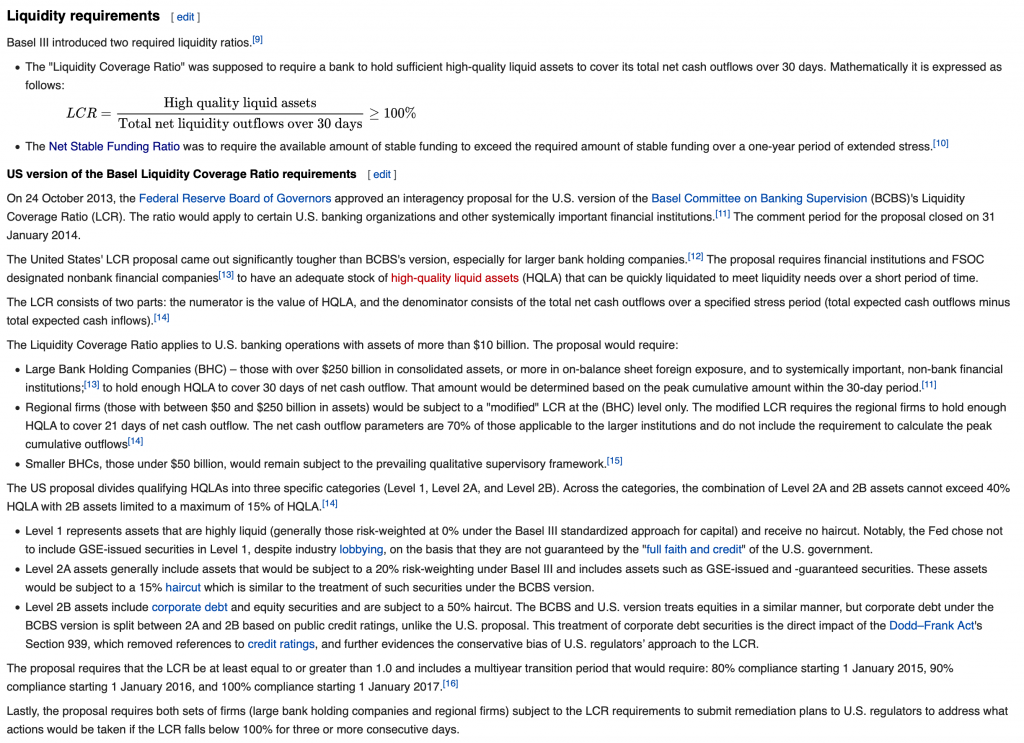
And here’s the NSFR:
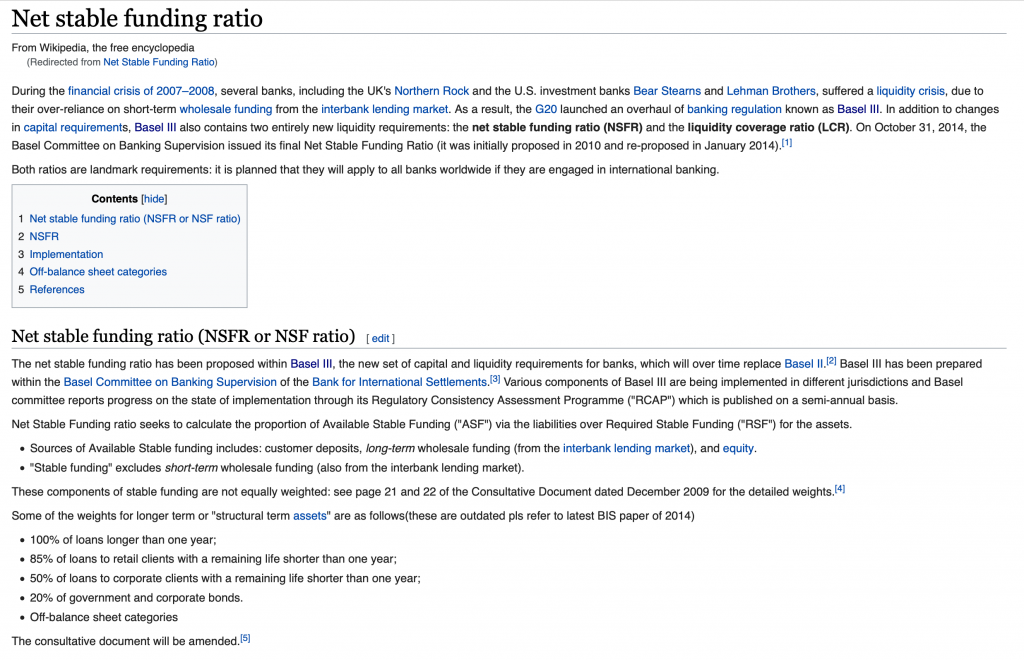
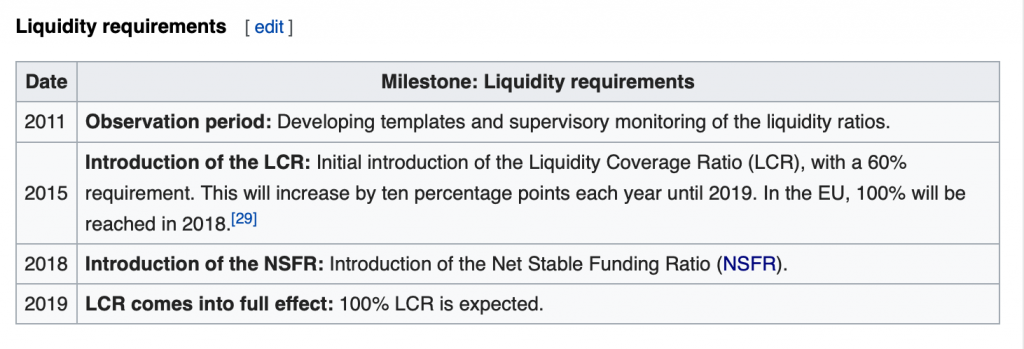
Complicated, obviously. The important thing is how it plays out in real-world action. These requirements have been slowly ramped up, and had full implementation only in 2019.
This is from JP Morgan Chase’s 2018 annual report.
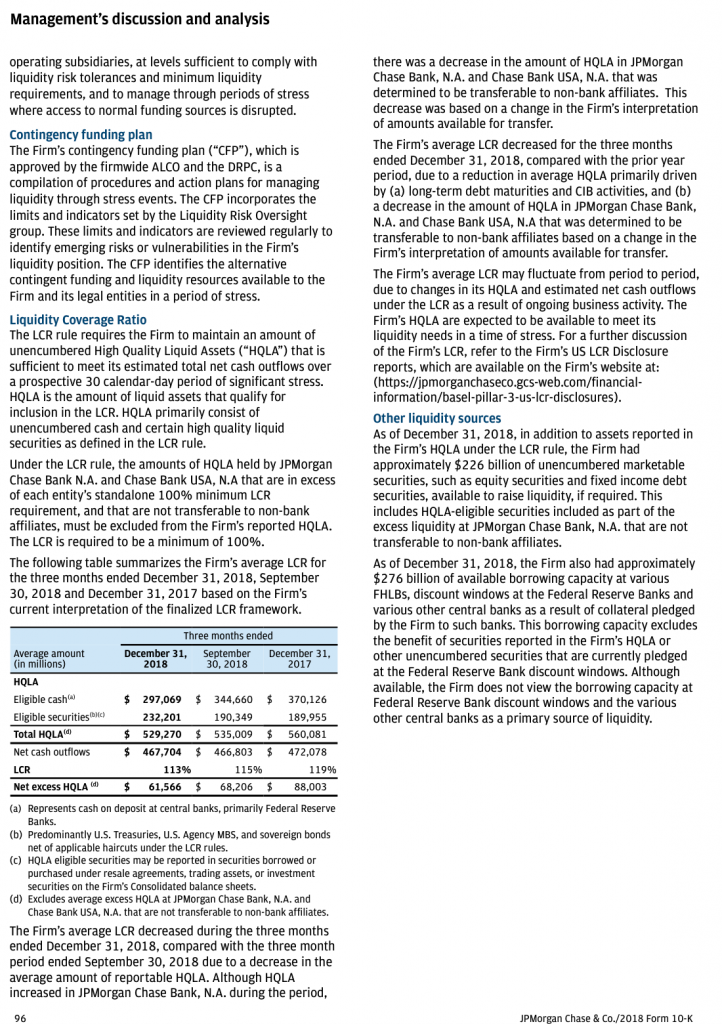
And so, we find that the “high quality liquid assets” amounted to $529 billion at the end of 2018, which included $297 billion of “eligible cash” which “represents cash on deposit at central banks, primarily Federal Reserve Banks.” This produced an LCR of 113%, which was a little (13%) in excess of the Basel III requirement of 100%. Since a little cushion is necessary to keep from falling beneath the requirements, 113% is about the “effective minimum requirements.”
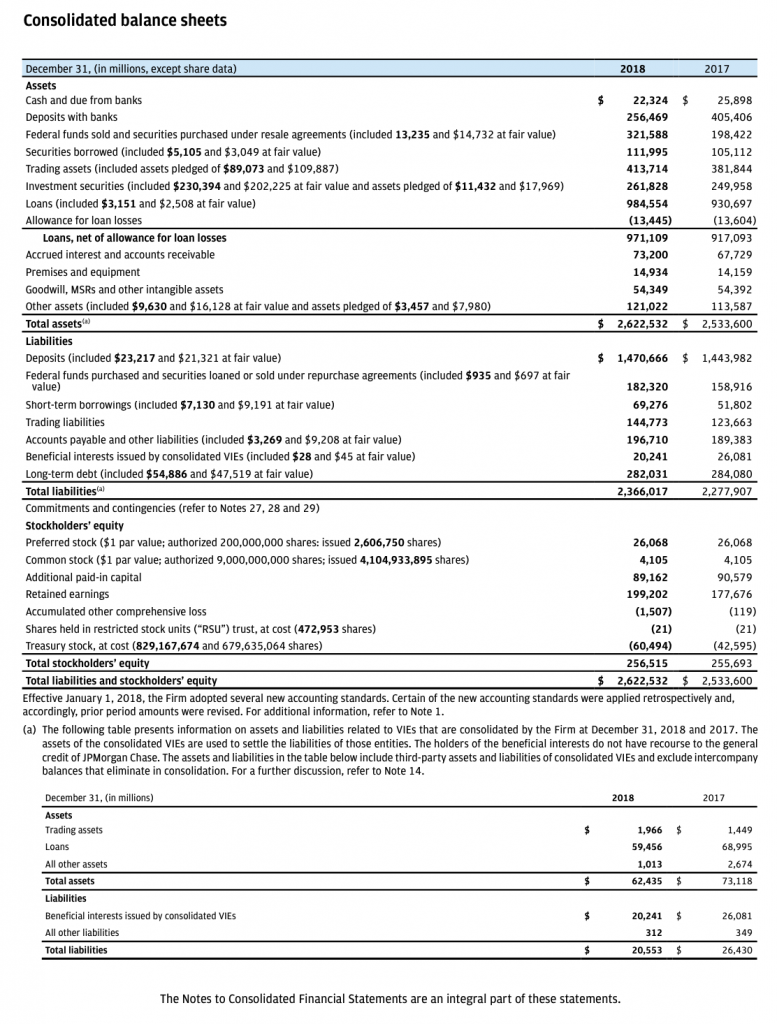
The total assets were $2,622 billion. So, the ratio of central bank deposits (“bank reserves”) to total assets was $297 billion/$2,622 billion, or 11.33%. It may be that JPM has some leeway as to how much HQLA is in the form of bank reserves, so there might be some flexibility there. But, given the existing parameters, whatever they may be, this was JPM’s decision.
We see that big banks like JPM are holding large reserves because they have to, to comply with Basel III, and also because, I argue, that it is a good idea. Obviously, if banks are going to comply with these requirements, then these bank reserves must exist, and that is why central bank balance sheets, in particular the Federal Reserve in this case, are larger than they were in the past.
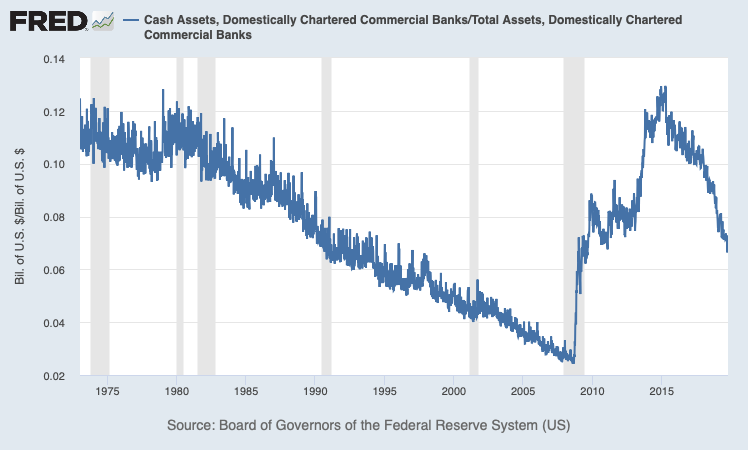
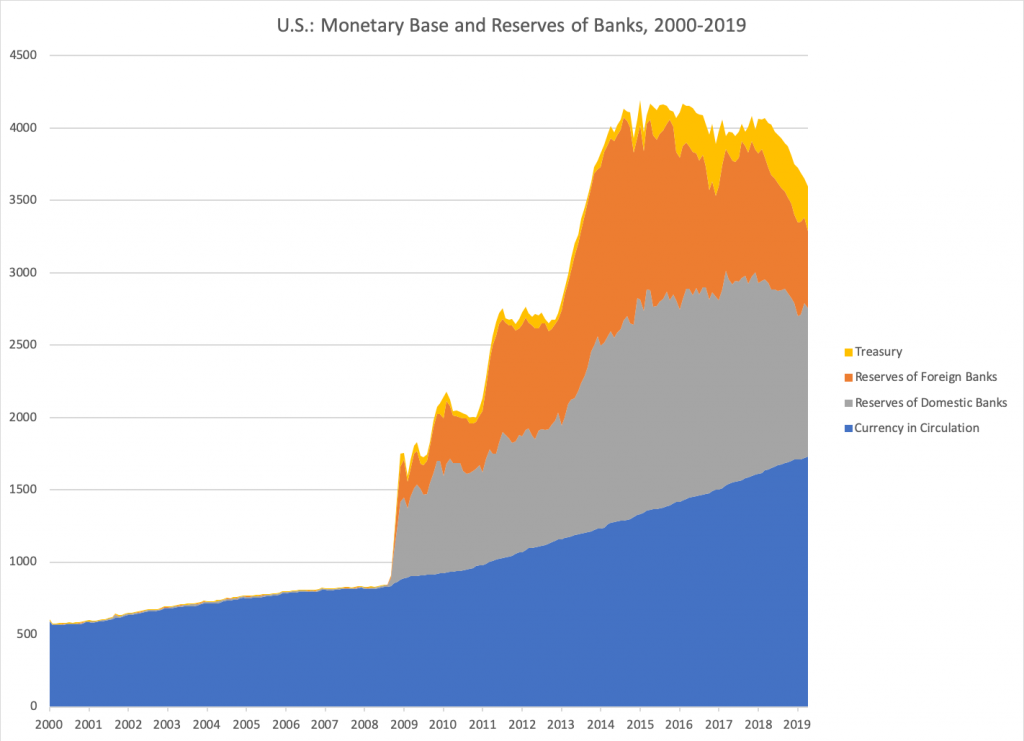
In the past, “cash assets” were a mix of Federal Reserve deposits and other instruments, but today they are basically Fed deposits exclusively. This is also the way it should be in my opinion, and also the way it was in the 1950s. Here we see that the recent bank reserve/assets ratio, among domestic banks, is about 7%. This is way below the 11.3% that is basically a requirement at JPM. This is updated to the most recent week.
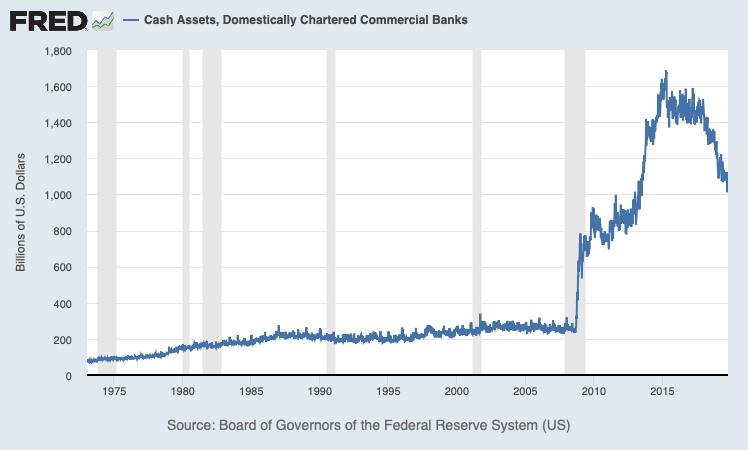
This is how it looks in absolute terms. “Cash assets” (bank reserves) have been plummeting. They are way above the levels of early 2008, but not very high if we now expect banks to hold 10% of assets in the form of bank reserves at the Fed.
I think that will be enough for today. I will add to this discussion soon.
