Let’s Resolve the Gold Standard “Deflation” Fallacy
November 21, 2015
(This item originally appeared at Forbes.com on November 21, 2015.)
http://www.forbes.com/sites/nathanlewis/2015/11/21/lets-resolve-the-gold-standard-deflation-fallacy/
Among the various things you hear about gold standard monetary systems — the monetary approach that the United States embraced for nearly two centuries — is the notion that it causes “inflation and deflation.” (The Cato Institute’s George Selgin had a recent discussion on this topic at Alt-M.org.)
This is a bit of an odd assertion, because the primary purpose of a gold standard system is to prevent monetary distortion that comes about by variance in currency value. (This monetary distortion is sometimes labeled “inflation” and “deflation,” but those terms are so vague, and used for so many different economic situations, that they are somewhat useless for precise discussion.) If people thought gold wasn’t doing its job properly, as a stable measure of value, they could have found some other solution during the many centuries it was in use. They never did.
The first error that is made (often on purpose, for rhetorical effect) by many economists is to claim that the “consumer price index” went up or down or whatever during the 19th century. But, there was no CPI in the 19th century.
Most economic statistics date from after the Great Depression. Governments decided that they wanted to “manage” the economy, and to do so they generated a lot of new statistics. The Consumer Price Index, as we know it, began to be compiled by the Bureau of Labor Statistics in 1940. Prior to that, beginning in 1919, the BLS compiled a wholesale price index, with backdating to 1914.
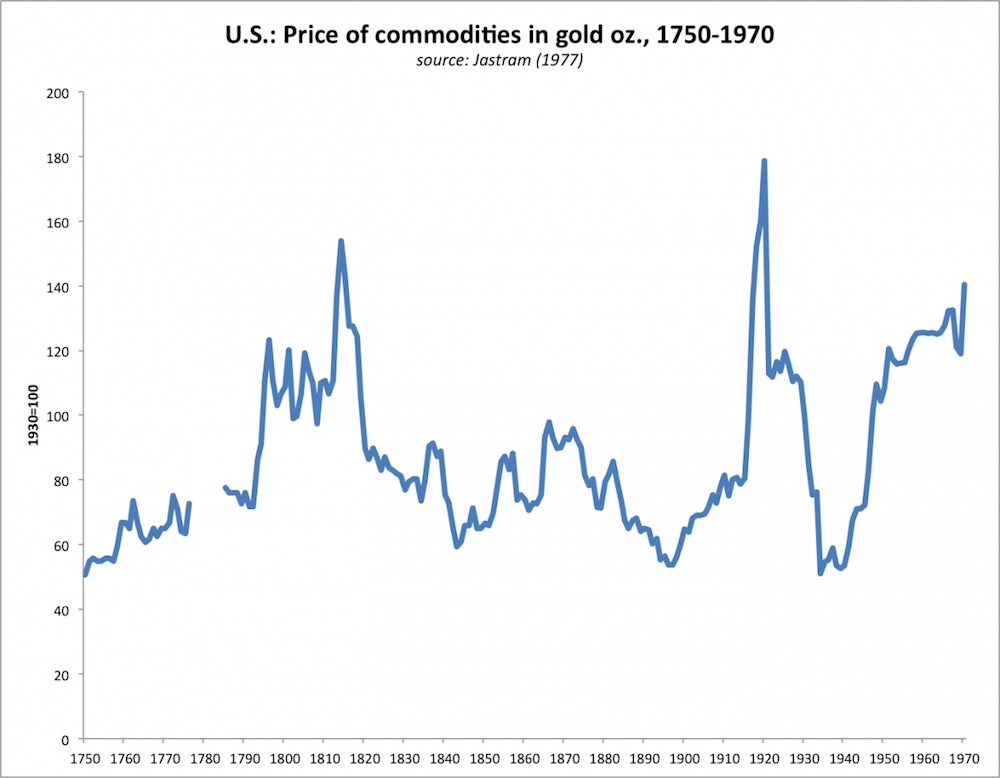
Before 1914, the most common price index referred to today is the Warren Pearson Index, which is an index of raw commodity prices in New York City (not nationwide), going back to 1750. Sixty-two percent of the Warren Pearson Index consisted of food and farm prices. Building materials (mostly lumber), fuel and metals added another eighteen percent. The remainder was a smattering of textiles, hides and leather, spirits and other minor items.
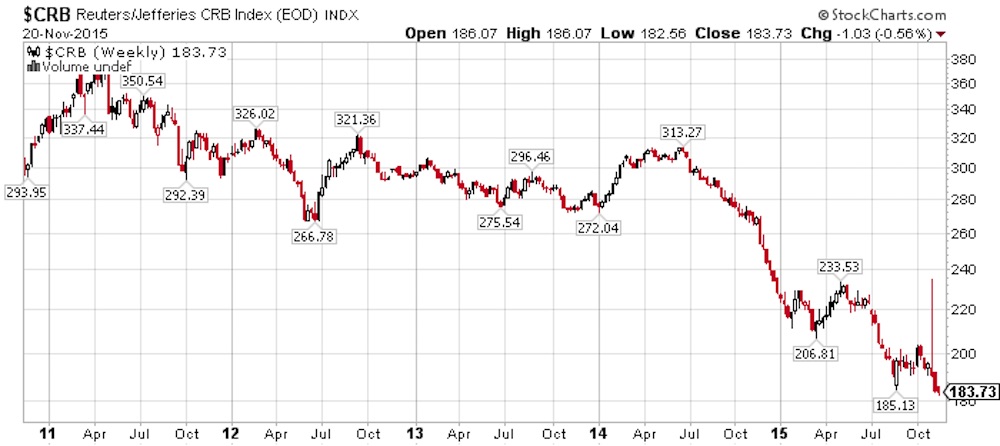
This was nothing at all like today’s CPI, which is dominated by things like rent, healthcare, and education. Indeed, most of what the Warren Pearson Index is composed of is expressly excluded from the “ex-food and fuel” versions of the CPI today. The Warren Pearson Index most resembles today’s CRB Commodity Index, which is highly volatile.
The second fallacy is to ascribe all changes in the Warren Pearson commodity index to changes in the value of money (gold), rather than changes in the value of commodities, as measured in a currency of stable value. First of all, we should probably ignore the wartime periods, notably the First World War and the Napoleonic Wars period (1795-1820). You would expect that to affect commodity prices.
During times of peace, if the WPCI falls 20%, perhaps due to a large crop of wheat and corn, we are told to assume that this means that gold’s value increased by 20%, resulting in a monetary “deflation.” This makes no sense at all. Maybe it was just a decline in the value of corn, as measured in a currency of stable value.
We are also led to assume that this 20% decline in commodity prices is supposed to be equivalent to the kind of economic event that might cause a 20% decline in today’s CPI, which would be very dramatic. But, that wasn’t the case at all.

In this discussion, the time period that tends to come under greatest scrutiny is the period from around 1880 to 1910. Commodity prices did indeed fall by a significant amount in the 1880-1895 period, such that many farmers were struggling. In the presidential election of 1896, the Democratic Party wanted to devalue the dollar by about 50% via “free coinage of silver,” which would raise nominal commodity prices and allow farmers to repay their debts more easily. The Republican Party promised to keep the dollar’s gold basis. The Republicans won.
Thus, even in this time that people might heap the most blame upon gold — as a standard of monetary value — Americans voted to keep the gold standard, and discarded the arguments of the inflationists.
To put some numbers on it: In 1896, U.S. commodity prices (in terms of gold) hit a low that was 33% below the average for the 1820-1880 period. (This avoids the Revolutionary War and the Napoleonic Wars period 1775-1815.) That decline took place over sixteen years, averaging a little more than 2% per year.
That might be a little troublesome. But, I would note that the CRB commodities index just fell from a high of 313 in June 2014 to a recent low of 183.60 – a decline of 41% — in just seventeen months.
Oops.

We are accustomed to this. The kind of volatility that we see all the time, in our floating-fiat world, was once-a-century stuff in the gold standard era.
Statistically, the standard deviation in commodity prices over a one-year period was 16.17% during the floating-currency era from 1971-2012, and 8.59% during the gold era from 1750 to 1970. On an apples-to-apples comparison, the floating fiat era has much more price volatility.
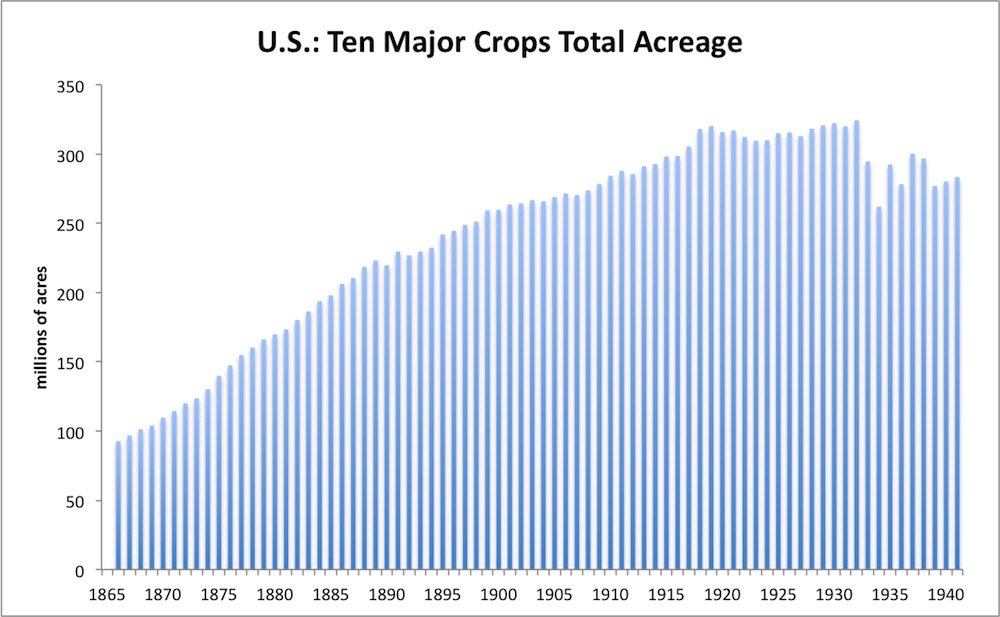
The 1880s and 1890s were a time of huge expansion in commodity production worldwide. Vast expanses of the United States and elsewhere were opened up with railways, which allowed shipping of farm products outside the immediate local area. In the U.S., acres under production soared. Between 1870 and 1895, total U.S. acreage under production for the ten major crops rose from 109.6 million acres to 242 million acres – a rise of 121%. In just one generation, the amount of land under cultivation more than doubled. (That is why there were so many farmers with mortgages in 1896.) However, growth soon slowed and then flattened. In 1915, 298 million acres were under cultivation, an increase of just 23% over twenty years. In 1940, it had actually fallen back to 280 million acres.

Much the same thing was happening throughout the world, as new railways and steamships allowed the expansion of commercial agriculture, mining and forestry across vast swathes of Argentina, Brazil, southern Africa, and Australia.
So, maybe it was just a case of capitalist overinvestment. Overproduction and low prices resulted, investment and expansion waned, and prices thus returned to their long-term averages. Maybe there wasn’t any monetary element at all.
Since we are asked to imagine that these declines in 19th century commodity prices are equivalent to the kind of economic event that might make today’s CPI fall by 30% or more — a catastrophe! — let’s see if there was any evidence of catastrophe.
During the 1880-1912 period, U.S. industrial production increased at a compounded rate of 5.37% per year. Pretty good! This includes the “deflationary” 1880-1896 period, when industrial production rose by: 5.35% per year. It was actually a bit better than the prosperous 1950s and 1960s, when industrial production rose by 5.20% per year. And the floating fiat era? From 1971-2012, industrial production rose by 2.30% per year, with most of that during the “Great Moderation” period of the 1980s and 1990s, when the dollar’s value was stable vs. gold – arguably, a crude sort of gold standard system. (I address many of these topics in my book Gold: the Monetary Polaris.)
And what of the “one Fed-induced asset bubble after another” period of 2000 to the present? Over those fifteen years, U.S. industrial production rose a grand total of thirteen percent. Under 1% per year. Less than population growth.
It appears that the difficulties of farmers in the 1890s were not shared by the economy as a whole – which suggests that it wasn’t really a monetary event, but rather something related to commodity production.
Yes, it’s true that there was a major expansion in gold production following some major finds after 1895. However, there was an even-larger expansion in gold production after 1850, which didn’t influence commodity prices very much. Even at its height, the post-1895 gold boom did not raise mining production to more than 3.5% of existing aboveground stocks per year, compared to a long-term average around 2%. Maybe it wasn’t important.
I am not the only one who has come to these kinds of conclusions. Michael Bordo, John Landon Lane and Angela Redish, in a 2004 paper prepared for the Federal Reserve Bank of Cleveland, found that:
Maybe the changes in commodity prices during the 19th century were just … changes in commodity prices, measured in a stable unit of account. And if gold, perchance, did not quite achieve this ideal of a “stable unit of account,” maybe its deviation from that state of perfection was minor enough that it didn’t really matter much.
The “worst case scenario” from the 19th century was actually pretty darn good – better than anything that has been achieved with floating fiat money since 1971.
Maybe that’s why people used gold as the basis for their money for the past five thousand years.

