The Bank of England, 1720-1913
March 24, 2013
It took me a while to accumulate data on the Bank of England for 1844-1913. The source was the London Gazette, which is searchable online here:
http://www.london-gazette.co.uk
March 3, 2013: The Bank of England 1720-1844
I want to thank Zeeshan Akhtar, of the Bank of England’s research and statistics department, for pointing me toward this source of data which the BoE itself (!) didn’t have.
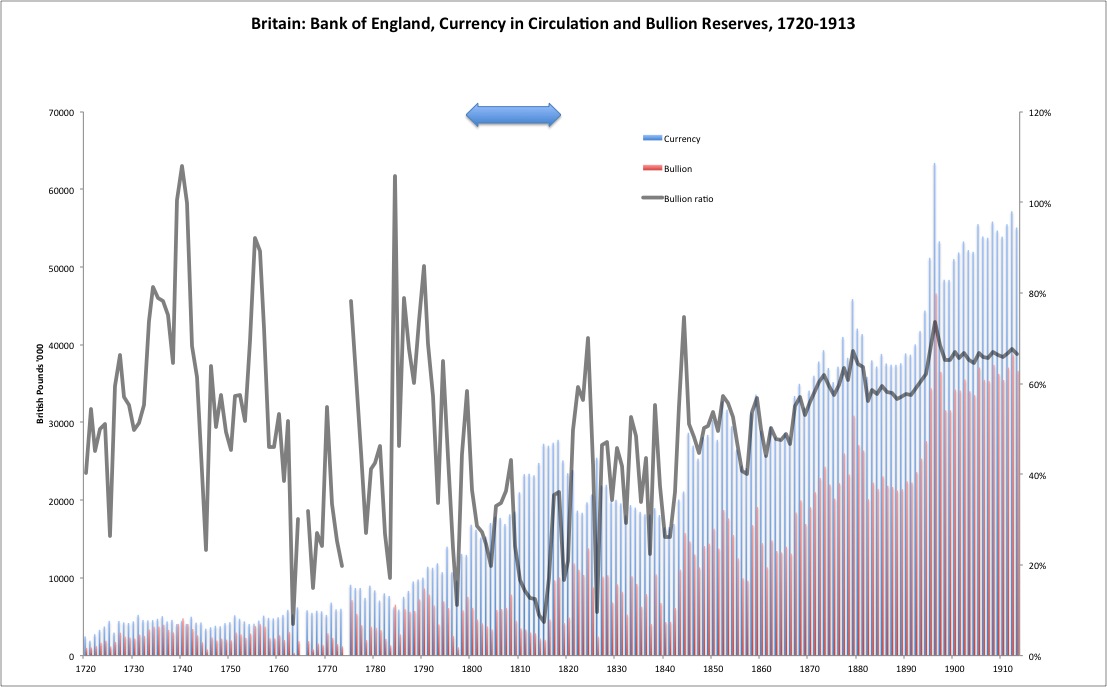
This allows us to present — tadaaaah! — an overview of the history of the Bank of England from 1720 to 1913. Nearly two centuries of managing what was, during that time, the world’s premier international currency, on a gold standard system with a parity throughout this time of £3 17s 10.5d per ounce of gold. (Except for the wartime floating currency period described below.)
In 1844, there was a new regulation of the Bank of England, which separated the Bank into an Issue Department and a Banking Department. The Issue Department was solely responsible for issuing and managing banknotes, or “currency in circulation.” The Banking Department was responsible for lending, including deposits. We recognize today that deposits at the currency issuer (central bank) are a form of base money, much like banknotes, because they are accepted as an ultimate form of payment. Thus, what we now recognize as “base money” was split between the two Departments. This introduced some funny issues, which we may talk about in much more detail later.
For now, what we have is the Currency in Circulation alone, plus bullion reserves (gold and silver, essentially 100% gold after 1850) held by the BoE. After 1844, I am including only bullion reserves held by the Issue Department. The Banking Department also had a little bullion, but it was negligible.

The blue arrow denotes the floating currency period during the Napoleonic Wars, 1797-1821. You can see that Currency in Circulation rises considerably during that time. Yes, the BoE was “helping” the government fund the war, by way of keeping the Discount Rate at a steady 5%, below the market rate. In effect, it was a way to “keep a lid on interest rates,” which should be a little familiar today, no?
The data from 1844-1913 is annual from late February, the same as the earlier data. Late February might seem like an odd time to measure from, but it avoids seasonal oddities around the harvest season and yearend.
Around 1821, Currency in Circulation drops dramatically, as part of the process of returning to the gold standard at the prewar parity. This is exactly analogous to what the Federal Reserve did precisely one century later, in 1921.
March 25, 2012: The U.S. Dollar During WWI and the Recession of 1920
What do we see here?
One thing we see is that the “bullion reserve ratio,” in other words the ratio of bullion reserves to Currency in Circulation, is all over the place. It was never 100%, and indeed never any stable figure. It gets a lot more stable after the reforms of 1844, which is one reason the reforms were instituted.
Currency in Circulation rises a great deal during this time, from £2,480,000 in 1720 to £55,094,085 in 1913, an increase of 22x. This is vastly greater than the estimated increase of total world aboveground gold bullion of 6.9x over the same time period, from 112 metric tons in 1720 to 776 metric tons in 1913. It is also quite a bit less than the 163x increase in estimated currency in circulation in the United States, between 1775 and 1900 (a shorter time period).
January 9, 2011: The “Money Supply” With a Gold Standard 2: 1880-1970
January 2, 2011: The “Money Supply” With a Gold Standard
Although there is a general upward curve, from year to year there is quite a lot of variation in Currency in Circulation. It is not a smooth line by any means. Indeed, there are extended periods of decline, between 1880 and 1890 for example.
And there you go. Welcome to reality, not the fantasia of “gold bugs” (and academic Keynesians) who, despite their earnest good will, honestly do not know what they are talking about.

