The Smoking Gun
December 17, 2005
Paul Kasriel, the fine economist at Northern Trust, has identified something that helps answer a lot of questions that I’ve had, such as: why is the US stock market levitating despite relentless selling by US households, not to mention aggressive valuations and the deterioration of many economic measures?
Here’s Kasriel’s recent note. Please take a look, as we will be referring to graphs from this article.
http://www.safehaven.com/article-4293.htm
It has been a suspicion of mine for a while now–basically since about mid-2004–that US equities were being held up by plain government intervention. Some people turn green when they hear such notions, but government intervention in the stock market is quite common. Over the last ten years, we’ve seen it quite overtly in Japan, Hong Kong and Taiwan, for example, and covertly in other places as well no doubt. The wonderful people at Sprott Asset Management (www.sprott.com) have described in some detail the evidence of government intervention in the US stock market and gold market. Jim Puplava of financialsense.com has had material about this as well.
Kasriel notes a very strange happening: US corporations haven’t been spending much money on capital expansion. They’re just maintaining their existing facilities, for the most part. This means that they are accumulating a fairly large amount of cash, as they make profits from operations. Indeed, the ratio of cash generation to capex has hit a height not seen since the 1974 recession. This is not “bullish,” It tends to imply that corporate managers can’t find anything worthwhile to invest in. But at the same time, they are issuing debt at a brisk clip. The normal reason to issue debt is that you can borrow at 8% and invest in a project that makes 15%. But what you don’t do is borrow at 8% and hold cash at 4%. No, corporations are issuing debt and buying back their own shares in the market. By the truckload. At a parabolically increasing rate. But at the same time, corporate insiders are selling stock, also by the truckload. So let’s get this straight: a) managers can’t find anything to invest in, implying that the “on the ground” view of the economy is not so hot, and b) those same managers are selling their own stock as fast as the market will bear, but c) those same managers are also issuing debt at a rate not seen since 1999-early 2000, and d) those same managers are having the corporations they run buy back their own shares in the market at the fastest rate ever seen.
Does this pass the smell test?
At the same time, US households have also been selling US equities at a blistering pace. The Federal Reserve puts out a fascinating document once a quarter called the Flow of Funds report, which is a measure of cashflows. It is usually referred to for its measures of debt expansion, but I especially like the Table F.10 Derivation of Measures of Personal Saving, which shows what households bought and sold. Let’s look at some of the interesting bits from the most recent 3Q05 report. These are all annualized figures, so the actual sums for the quarter are about 1/4 as much.
- Total personal savings was negative $124 billion.
- However, net acquisition of financial assets was $1,050 billion.
- The favorite financial asset, in 3Q05, was cash. Time and savings deposits increased by $671 billion — the fastest pace on this table, with info back to 2001 — and money market funds gained $142 billion (once again these are annualized rates).
- Another $61 billion went into US Treasury bonds, and $338 billion into agency paper, a historically high rate. This $338 must be via some banking intermediary, since I know of no one who is buying this stuff directly. “Hey honey, I’ve got an idea. Seeing as Fannie Mae hasn’t declared financials in ages and says publicly that it doesn’t know how much money it is making, or not making, indeed doesn’t know if the super-leveraged institution is plain underwater, let’s go and buy boatloads of their paper hmmm?”
- Selling of US corporate bonds reached $351 billion.
- Households sold a net $556 billion of US equities, the highest rate of selling on this table.
- At the same time, net residential fixed investment (homebuilding and renovating) was $339 billion, the lowest rate since 2002, and these figures are not inflation-adjusted. This was a big drop from $513 billion in 2Q05, which was the highest figure on this table. Are you getting the impression that the housing boom has gone pffft?
- Net investment in consumer durables (cars, TVs, etc) also dropped to a rate of $203 billion, the lowest figure since 2001 (not adjusted for inflation by the way).
- However, the net increase in mortgage lending was $1,218 billion, the highest figure on this table.
- A simple measure of aggregate “cash-out” mortgage financing is the difference between net residential fixed investment and net mortgage borrowing. Now, the first is the lowest in years, and the latter is the highest ever. Thus, the rough “cash out” figure is $879 billion, at an annualized pace, or about 7% of GDP!
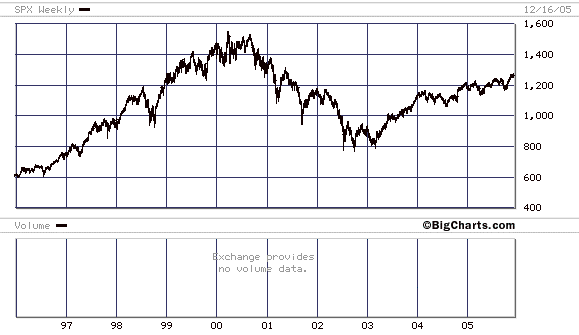
OK, let’s keep going. Looking at Kasriel’s charts (which alas I can’t reproduce here, so go to the link above), there’s not much going on during the first two-thirds of the 1990s, the we see the first big spike in corporate buybacks in 3Q and 4Q 1998. What did the stock market do at that time? Do you see the big selloff in 3Q-4Q98, and the rocket recovery? This was the Asian Crisis/Russian Default/LTCM period.
Second spike in corporate buybacks: 2Q-3Q 1999. There wasn’t as much of a selloff, but there is a big rally in 3Q.
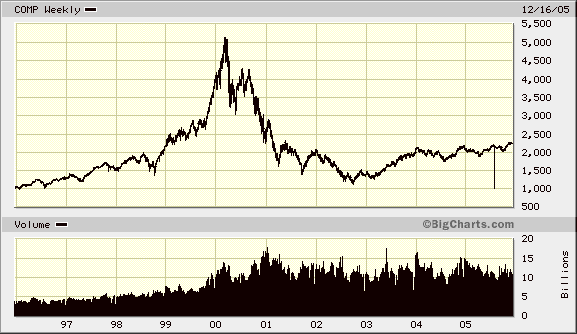
The third spike in buybacks was 2Q00. While not too much was going on in the S&P 500 at that time, the Nasdaq bubble was bursting. Do you remember that amazing day in April 2000 when the Nasdaq lost 500 points in the morning–and gained it all back in the afternoon?

Another spike in buybacks comes in 4Q00, when the Nasdaq was collapsing properly.
After that, the next big period of corporate buying activity starts in 2Q04, and ramps up in intensity to the present, when corporations are buying back stock at record rates. And of course the market has managed to recover from each of its dips since then, to the chagrin of the bearish set. One particularly amazing recovery of the S&P 500 was made in 4Q04, surrounding the phony Presidential election (it was jiggered by Diebold) of George Bush. Surely this was because of the surge of confidence of a happy public, thrilled that they had chosen the right man? The Fed Flow of Funds Report indicates that US households sold equities at an annualized rate of $457 billion, the highest rate on this table up until 3Q05. For comparison, selling hit a level of $487 billion in 2000, was $242 billion in 2001, and $93 billion in 2002. Do you remember the market going down in that period? Selling amounted to $303 billion in 1998.

All of this suggests an environment where one of the best things to do is hold cash, which is what US households are indeed doing. However, it is also a principle of investing that whatever everyone is doing can’t be all that great. Remember the inflationary message being sent by the dollar/gold market at this time. So what happens when corporations stop going into debt to buy stock? It just makes me a bigger fan of gold bullion.

