Changes in Base Money Demand in Germany
February 27, 2011
I’ve been making some points about changes in base money demand recently — primarily that the demand for base money can vary wildly, depending on the situation.
February 20, 2011: Demand for Base Money and Interest Rates
Here’s an interesting example from Germany during the hyperinflation years, 1920-1923. These tables are from Exchange, Prices, and Production in Hyper-Inflation: Germany, 1920-1923, by Frank Graham (1930). We see that academics loved their colons even in those days.
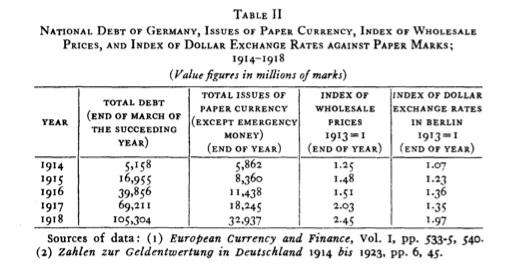
Here is Germany during WWI. At the end of 1918, the mark had depreciated by about 2:1 against the dollar, which was (more or less) gold-linked at the time. However, issuance of banknotes had expanded wildly. This might have a rational reason — people maybe don’t trust banks too much during a war, so they withdraw their deposits and hold banknotes. The effect, however, was that the government was able to finance the war pretty much with money-printing, without a lot of consequences. In other words, although the base money supply increaased by about 5.5 times, the value of the currency fell by only about 2 times (i.e. in half).
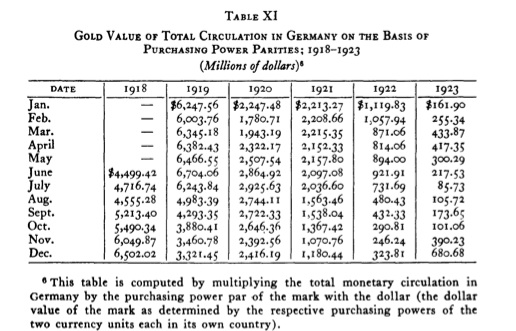
This is a table of the gold value of the German base money supply (circulating currency) during the hyperinflation years. It is expressed in dollars. If you divide by $20.67, you would get the figures in terms of troy oz. The author notes that the figure for 1913 was about $1,430m.
We see that the gold value of the circulating currency held steady for a while, then collapsed into early 1920. It then held steady for a while longer, and collapsed again into late 1921. From the beginning of 1922 into the nadir of November 1923, it steadily declined. The total amount of decline — from a peak of $6,704m in June 1919 to $85m in July 1923 — was an astonishing 79:1 ratio! Wow. Of course, the reason for this decline is that nobody wants to hold a currency that is depreciating rapidly. Oddly enough, what happens in a hyperinflation is that nobody has enough money. You wouldn’t think such a thing is possible when the printing presses were literally running day and night. But that was actually a major reason why the printing presses were running day and night. All sorts of people (including government agencies) were telling the central bank, “we don’t have any money! We need to pay our workers etc. in the next three hours or they will go on strike.”
Another result of this collapse in base money demand is that the value of the currency falls much more than is proportional to the amount of money printed. This was the opposite of what first happened. During 1913-1918, the government printed a lot of money, but not much happened. Later, it seemed like the government was not printing that much money, but the value of the currency (as expressed in foreign exchange markets for example) was plummeting. Naturally, the government blamed speculators.
Here is some information on exchange rates. The relevant column is on the far right. It is normalized to 1.0 for the gold-standard prewar exchange rate. The leftmost column is a record of banknotes in ciruclation, once again normalized at 1.0 for 1913.
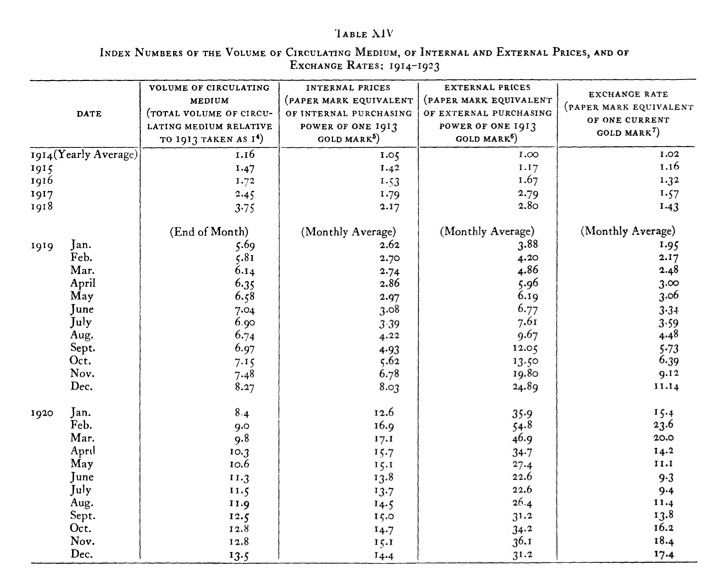
1919 was quite a year for currency collapse. The year began around 2.0 (i.e., the mark was worth about half its prewar value compared to the gold-linked dollar), and ended around 11. That is a 5.5:1 depreciation. We can see that about half this depreciation was due to revulsion of demand — the total gold value of the circulation dropped in half in 1919.
The depreciation continued into early 1920, reaching 23.6 in February 1920. This was about a 10:1 decline from January 1919, but the banknotes in circulation increased by only about 58% (5.69 to 9.0) during that period!
Then — forex and gold traders take note — the mark more than doubled in value to 9.3! Contrary to what you might think, it wasn’t necessarily all that easy to trade the hyperinflation. During 1920, it appeared that the currency collapse had been halted. Note that base money continues to grow, although more slowly. By the end of the year, the mark had deteriorated again, but it was around where it had started the year.
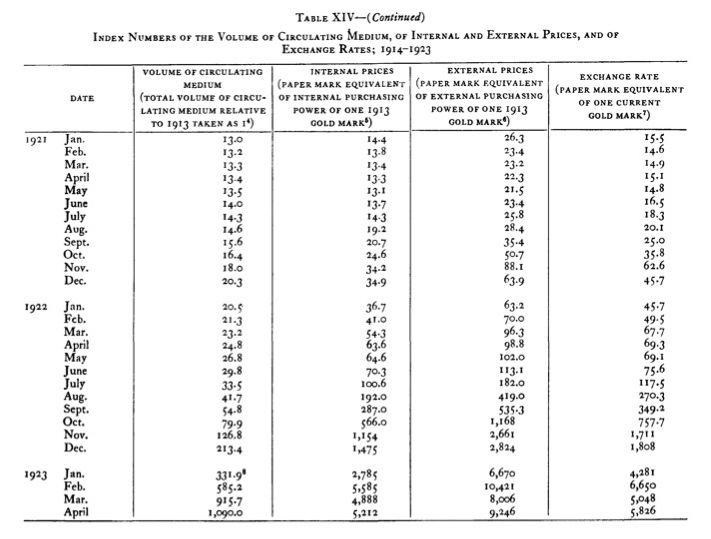
In the first half of 1921, the mark is still pretty stable (relatively), reaching August 1921 around the same value as it was in early 1920. Then it collapsed again to 62.6, before rebounding to 45.7. Gold traders — ouch! Remember that these are monthly averages. The daily extremes would have been bigger. Again there is a brief period of sort-of-stability, and we get to June 1922 around the same level as November 1921. At this point, the currency begins its final spiral into oblivion, which takes less than a year and a half. By the end of 1922, the currency has depreciated by another 25:1 or so, finishing at 1,808. However, even in this collapse, gold traders get lots of excitement as it goes from 6,650 in February 1923 to 5,048 in March.
Look at the banknotes outstanding. In January 1922, it was 20.5, compared to 5.69 in January 1919. That is a 3.60:1 ratio — a lot, but a pittance compared to the 23:1 decline in the exchange value of the currency. Remember that prices would have been rising by a lot too, which would increase the apparent need for currency.
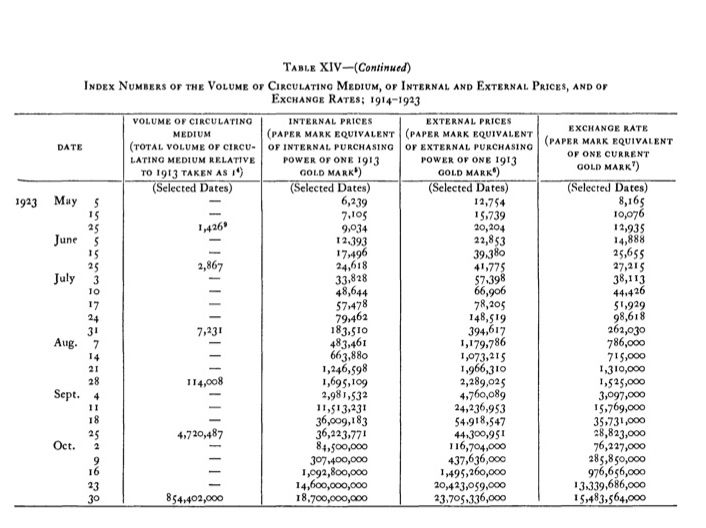
The final collapse is so intense that we now go to weekly data. It is pretty much a one-way street here, although there are relatively quiet periods and also explosive depreciations. Between August 21 and August 28, the currency goes from 1,525,000 to 15,769,000, a 10:1 devaluation in a week.
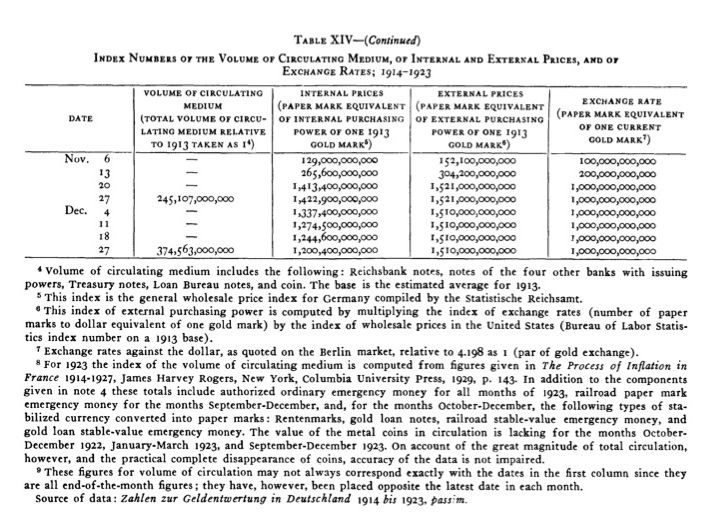
At the end, people do not accept paper currency for any reason, and the government gets a “divide by zero error.” This is the point at which they say: “OK, the game is up, time to go back to a gold standard.” And they did! It took about one week to transition from the hyperinflationary mark to what amounted to a new gold-linked mark. This was accomplished by a new Reichsbank governor Hjalmar Schacht, in an office with a telephone and one secretary. You can see above that the mark was repegged to gold at effectively a 1 trillion:1 ratio to its original value.
Think about that. All it took to go from hyperinflation to a gold standard was one guy with a telephone, the knowledge of how to do so, and the political support to do so. It doesn’t actually take any time, effort or resources.
Now here’s the really perverted part. What did the government do after it had pegged the new mark to gold? Did it refuse to print any more money?
No, exactly the opposite. It printed money! Day and night! This was because the demand for money then expanded, from about its $101m gold value at the end of October 1923 back to a more typical level, probably around $1,500m or so. This hypothetical 15:1 expansion in the base money supply (I’m guessing at the actual figures) took place with a gold-standard system. You can see it begin in the second table from the top. By the end of December 1923, the gold value of the circulating currency had risen from $101m to $680m! A 6.8x times increase in the space of less than two months, all of it due to the printing press, since the mark, although it did not fall in value after being pegged to gold again, did not rise in value either.
Try to get your head around that one.

