Updating Our Commodity Charts
June 6, 2008
Can you believe six months have passed since we last updated our commodity charts? How time flies. It seems like prices have flown higher as well, but in “real money” terms — how many gold coins it would take to buy these commodities — they are still at historical bargain-basement levels. While I think there is an argument that it is about time for real commodity values to get up off the floor, at the same time, inflation would tend to depress commodity real values even as nominal prices rose. As nominal prices rise, people can afford less of it, so they cut back one way or another.
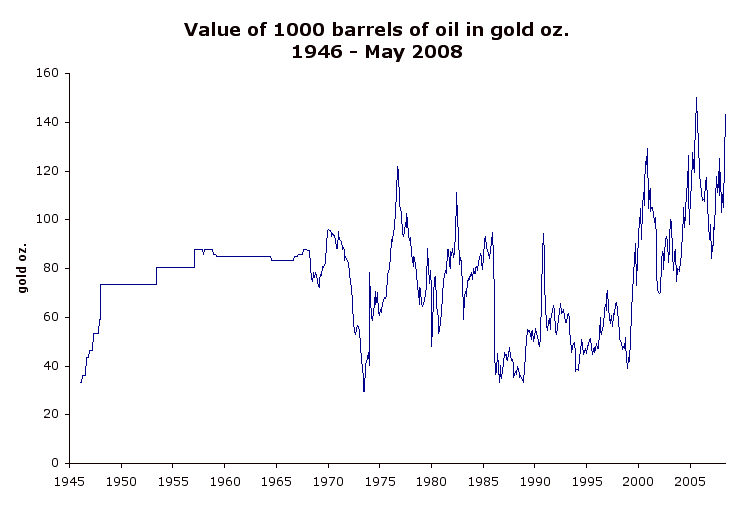
Crude prices are nearing their historical highs. I think they can correct lower. However, “Peak Oil” is likely to maintain a trend towards higher real prices here. There might be a bit more upside possible.
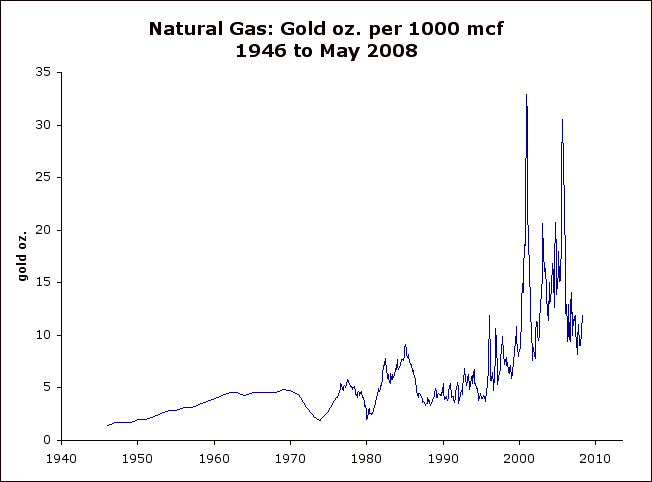
It’s easy to forget that when natgas hit $15 in autumn 2005, gold was around $500/oz. Now it’s closer to $1000/oz. In other words, natgas is much cheaper at $12 today than it was at $12 in 2005. The natgas situation in North America is like Peak Oil on steroids — although unusual weather has masked this fact in recent years. I think $30 natgas is possible in the next two years.
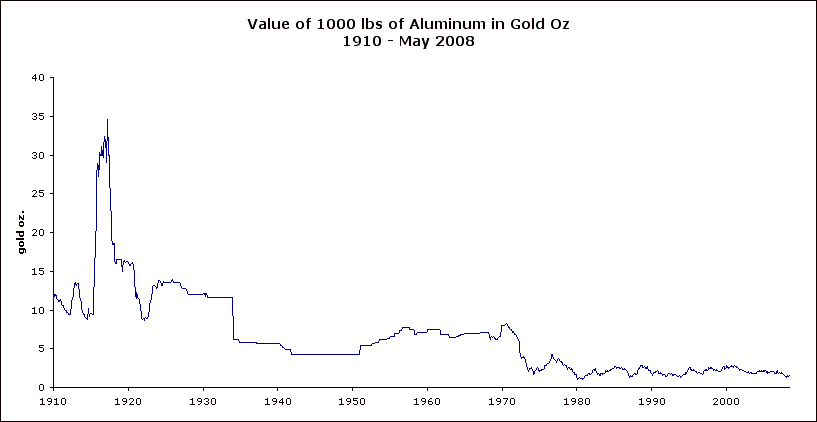
Aluminum is still cheap. Aluminum is one of the most common elements in the earth’s crust, so there should never be much limitation there. The limitation is primarily electricity.
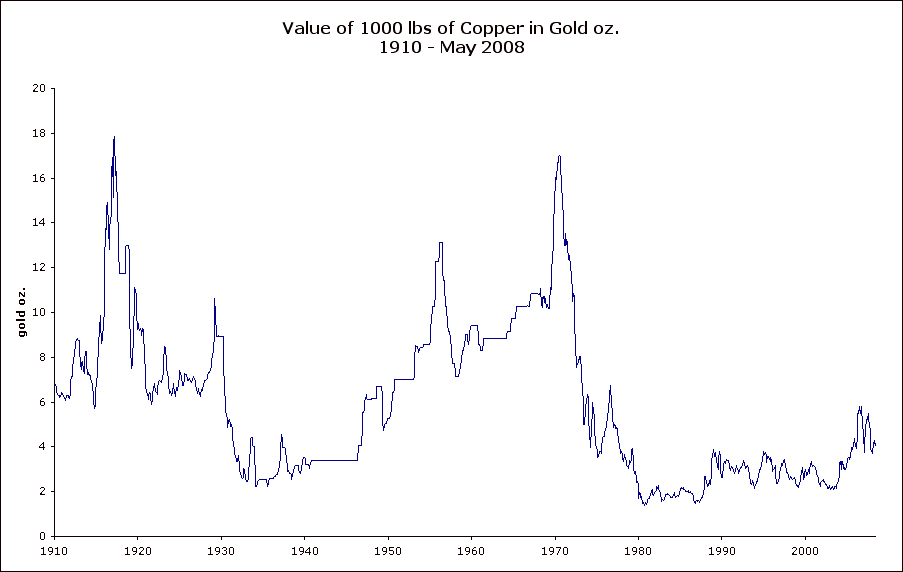
Copper is off its lows, but not really all that high in historical terms.
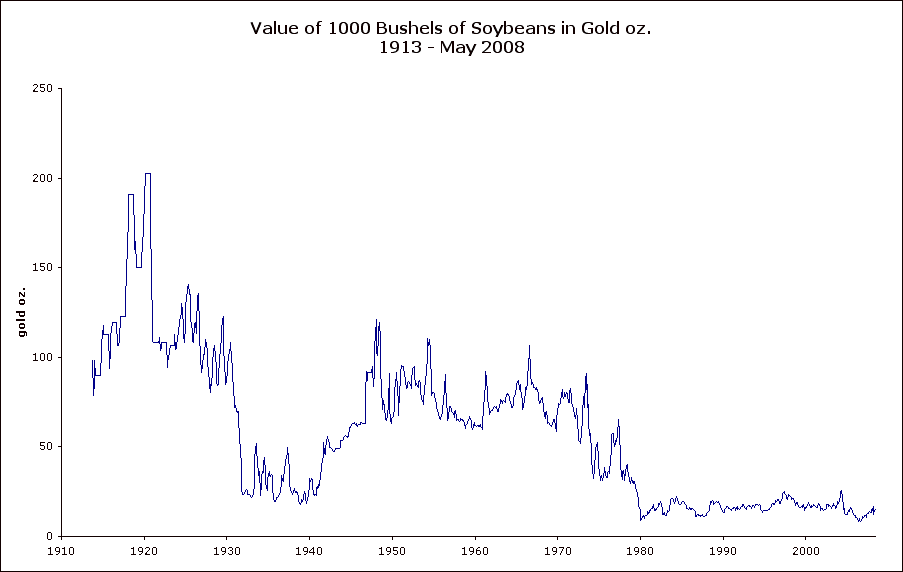
With all the hoopla over higher grain prices in the last year or so, you’d think something would show up on this chart. But, actually the grain price increases thus far can be explained entirely by monetary inflation. What might happen if there is a real shortage?
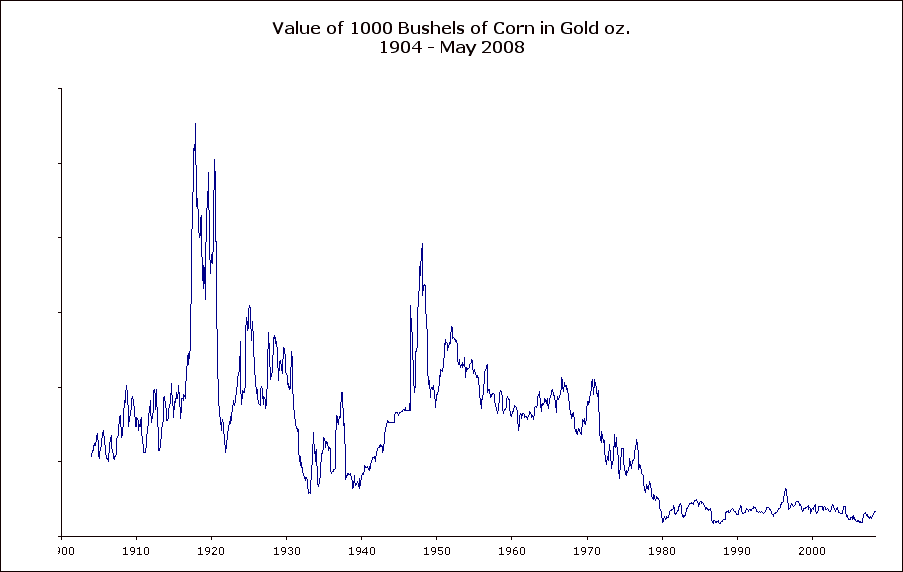
Corn is cheap.
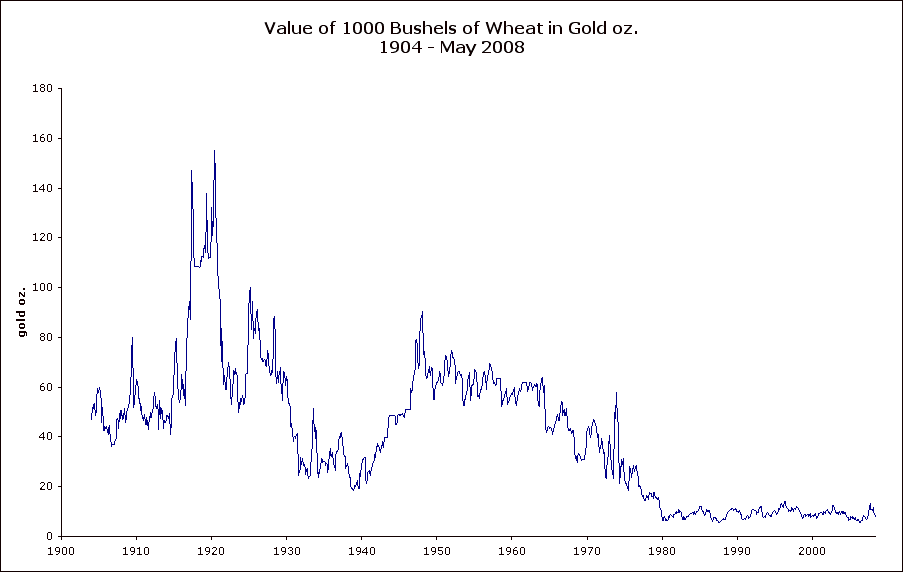
Wheat is cheap.
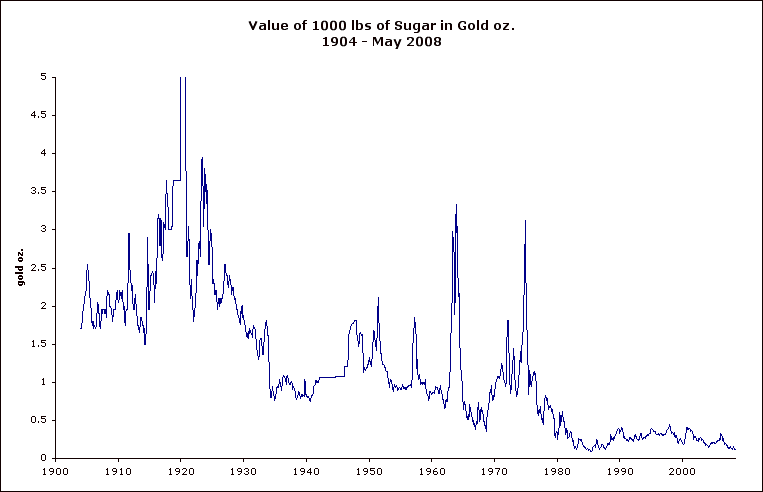
Sugar is stupid cheap, if you ask me.
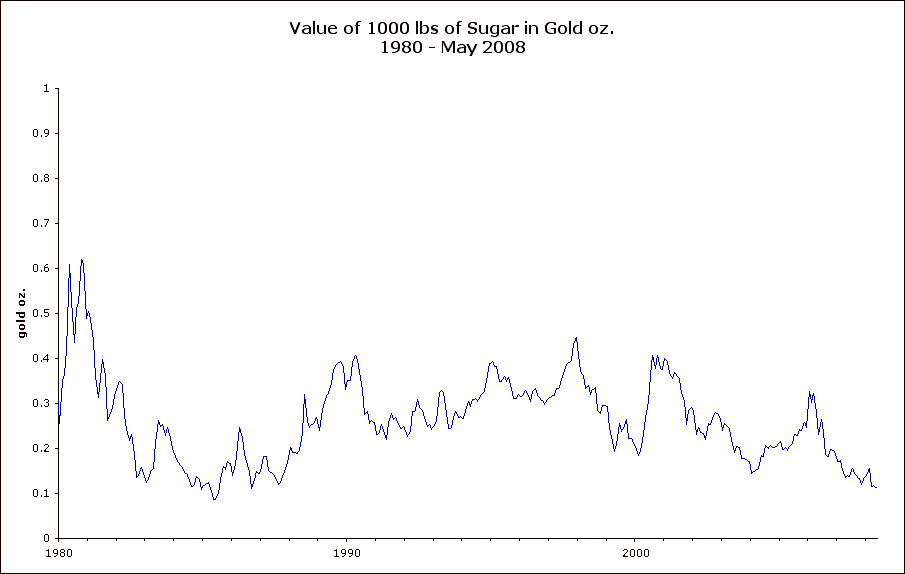
If sugar rose just to the top of its 1980-2008 range, around 0.4 oz/1000lbs, it would quadruple.

