
I usually don’t spend much time talking about current events as regards the Federal Reserve and other central banks. There is already a lot of babble about this — the usual econobabble that constitutes the “PhD Standard” — and I find that it is better to investigate many other neglected topics instead.
Nevertheless, this is a topic that might be important, so we will look at it a bit here. I am talking about the reserve holding characteristics of banks, which then translates into Federal Reserve policy since the “reserves” of banks are basically deposits at the Federal Reserve, a component of “base money.”
I thought I talked about this in the past, but all that I can find is an item on Japan, here:
September 21, 2014: Japan 2014: “Abenomics” and the Assets of Banks
It might also be worthwhile to review my series on “how banks work:”
Typically, banks have a simple balance sheet structure. On the side of Assets, we normally find about 70% loans (traditionally held on the balance sheet and rather illiquid, although these are more commonly securitized and traded today), 20% bonds (tradeable), and 10% cash. The bank needs the cash to meet any payment obligations. Bonds typically pay a higher interest rate than cash, and can be liquidated easily in case the bank runs out of cash, but bear some market risk. On the side of Liabilities, we typically find a combination of time deposits, bonds, demand deposits (90%) and shareholder’s equity (10%).
This information is contained in the Federal Reserve’s “H.8” report, which comes out weekly. Here is how it looked recently:
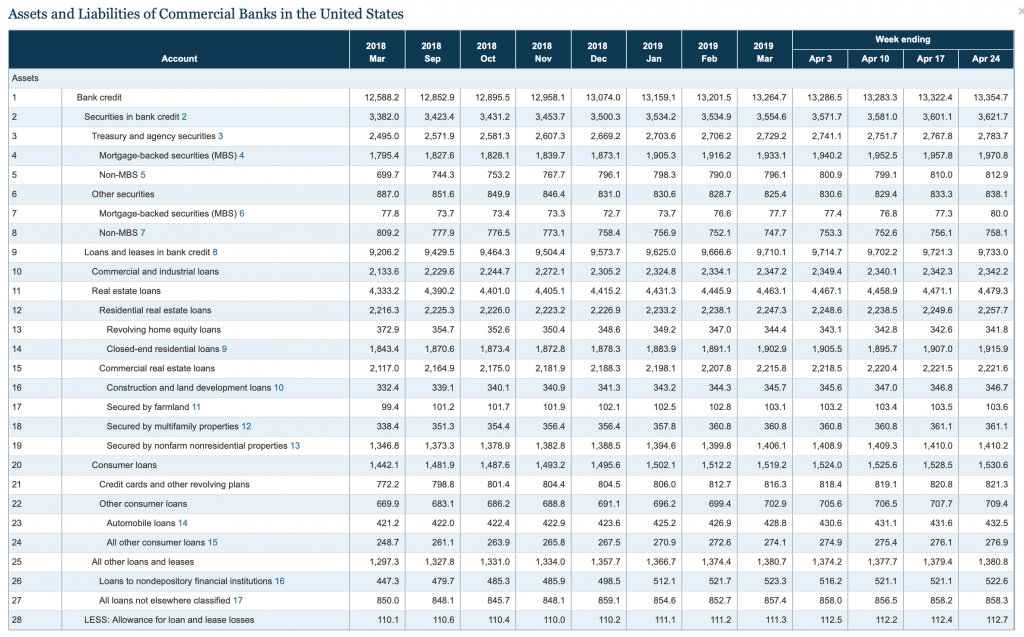

Taking the recent March 2019 numbers, we find:
Total Assets: $17,179B (100%)
Cash Assets: $1,838B (10.7%)
Securities: $3,564B (20.8%)
Loans and Leases: $9,710B (56.5%)
This leaves a little remainder, which is:
Total Federal funds sold and reverse RPs: $731B (This is basically lending structured as a repurchase agreement)
Loans to Commercial Banks: $17.1B
Other Assets including Trading Assets: $1,431B (This is related to various trading and derivative operations, and probably includes a lot of securitized debt that hasn’t been sold yet.)
So we see that these “other assets” are largely forms of debt as well, and can be bucketed into “loans and leases” for simplicity. This produces:
Loans, leases, and other credit assets: $9,710B+$731B+$17.1B+$1,431B=$11,889.1B (69.2%)
So we see that my 10:20:70 ratio is nearly spot on.
On the Liabilities side, we have:
Total Liabilities: $15,212B
Deposits (time and demand): $12,563B
Borrowings: $1,969
Other: $680B
Residual (shareholders’ equity): $1,959 (11.4%)
On the Liabilities side, we see deposits and borrowings of 89% and equity of 11%, once again almost exactly my 90:10 framework.
Here is how it looks since 1973:
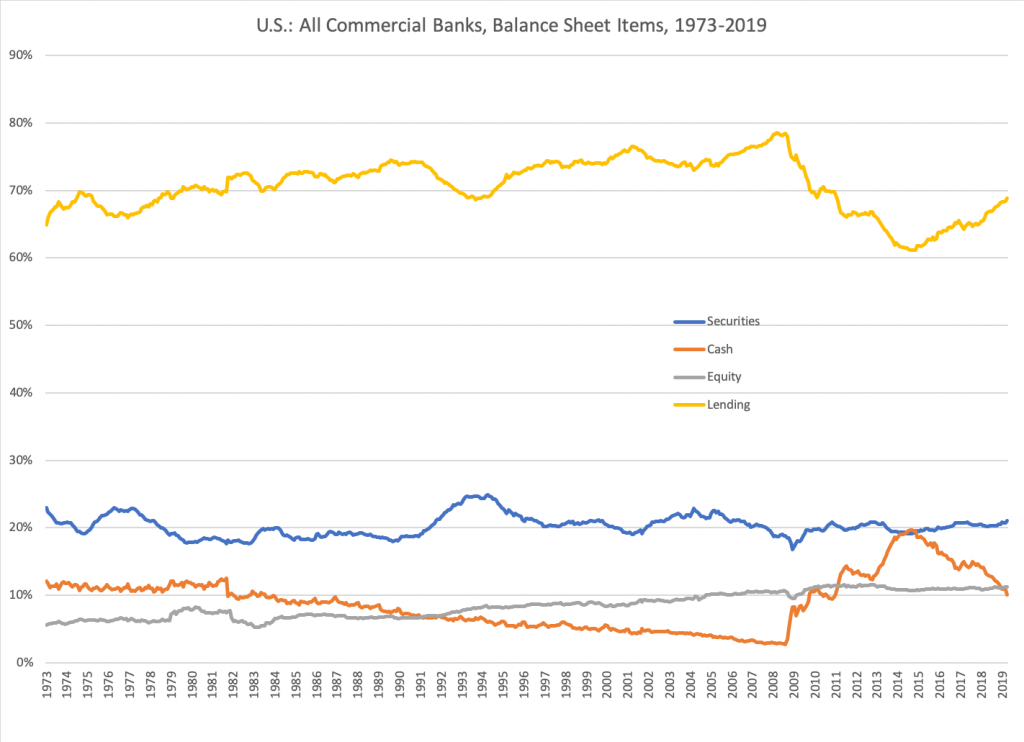
This is all represented as a percentage of Total Assets. The most noteworthy thing that we see is the long decline in Cash Assets from about 10% in 1973 to a low of about 3% in 2008, then a big rise in this figure to nearly 20%, and then a decline to about 10% again recently. This rise has to come out of somewhere; and we see that lending, as a portion of the balance sheet, shrank to compensate for this large rise in Cash Assets. Also, note that Equity (shareholders’ equity, or capital) has been on a steady rising trend, from about 6% in 1973 to about 11% today.
The source of the data is here:
Federal Reserve data sets on banking
Now, for reasons that will later become clear, I will separate All Commercial Banks into Domestic banks and Foreign banks.
First, let’s look at Total Assets of foreign-chartered banks, as a percentage of Total Assets of All Banks:

Now let’s look at the Domestically-Chartered Banks:

Here we see the same patterns as before, no surprise since domestically-chartered banks make up about 85% of the total. But, note that Cash as a percentage of Total Assets is somewhat lower than before. It peaks around 12% and is now around 8%.
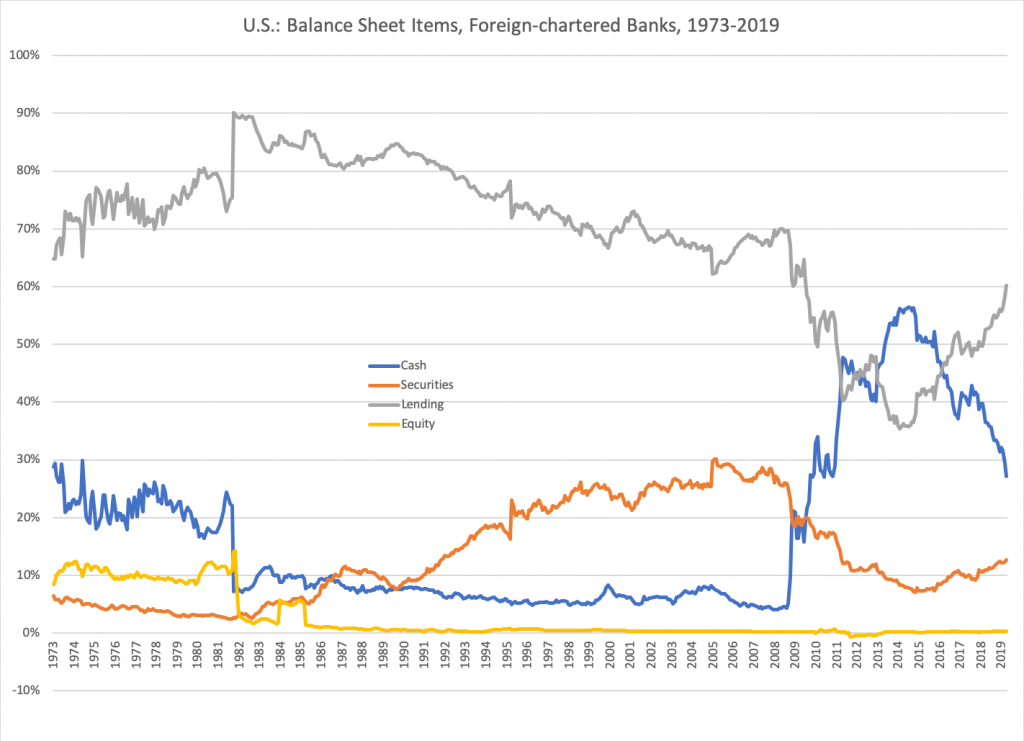
Naturally, the difference is found in Foreign-Chartered Banks, where Cash became a very high portion of Total Assets after 2008. This basically reflects the fact that these foreign-chartered banks are really just divisions of much larger foreign banks. In effect, you are seeing only one part of the total balance sheet of the foreign bank, the part that is held on the balance sheet of its U.S. subsidiary. As before, all of these figures are shown as a percent of total assets.
This is going to be a long and involved topic, so I think I will leave it there for now, and continue again later.
