
Let’s get an idea of the history of U.S. immigration, as this is a core component of the Capital/Labor Ratio. Why allow immigration at all? Who benefits? There have been many successful examples of countries with virtually no immigration, such as Japan, or Britain before recent decades. Basically, Capital benefits. More workers means cheaper labor.
The original black slaves were imported because they provided cheap labor. Actually, “indentured servants” (slaves) from Scotland were just as cheap, but they tended to die quickly when exposed to the tropical diseases of the South. Most did not make it through their first year.
Before 1840, there was not much immigration to the United States. In 1830, 98% of the population was native-born. The Naturalization Act of 1790 limited new citizens to “free white persons,” and immigration from developed European countries constituted nearly all immigration until 1970. Immigration picked up in the 1830s and especially in the 1840s, mostly an influx of Irish. (Ireland was part of Great Britain at that time.) Before 1870, almost all the new immigration came from Britain, Canada (then also a British commonwealth), Ireland and Germany, with the remainder from other developed European countries including France, Sweden and Switzerland.
Wikipedia on the History of Immigration to the U.S.
(For comparison, an estimated 2.3 million people emigrated to Britain over 145 years from 1800 to 1945, with 1,500,000 of them Irish; the foreign-born population in 1931 was under 2%.)
After 1870, there was a boom of new immigrants from Europe. Before 1900, this was again dominated by Germans, British, Irish and Canadians. After 1900, there were more Italians and Poles, and some Russians.
In 1921 a more strict quota system was imposed, limiting immigration still further and leading to a major decline in immigration afterwards. It allowed more migration from Northern European countries but severely limited immigration from Southern and Eastern Europe. Asians were almost banned completely.
In 1952, a new limit on immigration was set at 175,000 per year, from all sources, while national-origins quotas from the 1920s were maintained. Between 1944 and 1954, illegal immigration from Mexico expanded by an estimated 60 times, with a total of about one million illegal immigrants arriving during that decade. (The immediate result of this was that compensation for agricultural workers fell by half in Texas.) In 1954, Operation Wetback forced the return of thousands of illegal immigrants to Mexico, many of them leaving of their own accord after finding the environment in the U.S. inhospitable. Possibly up to 1,300,000 illegal immigrant workers returned to Mexico.
Thus, the period 1921-1965 was a time of increasing restrictions on immigration. It was also, I would argue, a time when the Lower 40% of U.S. society did unusually well, especially after 1950, with the Capital:Labor ratio swinging in favor of Labor.
The Capital:Labor ratio is not a zero-sum game, with one side winning and the other losing. Rather, it is mostly a matter of spreading a scarce resource (Capital) among a greater or lesser amount of Labor.
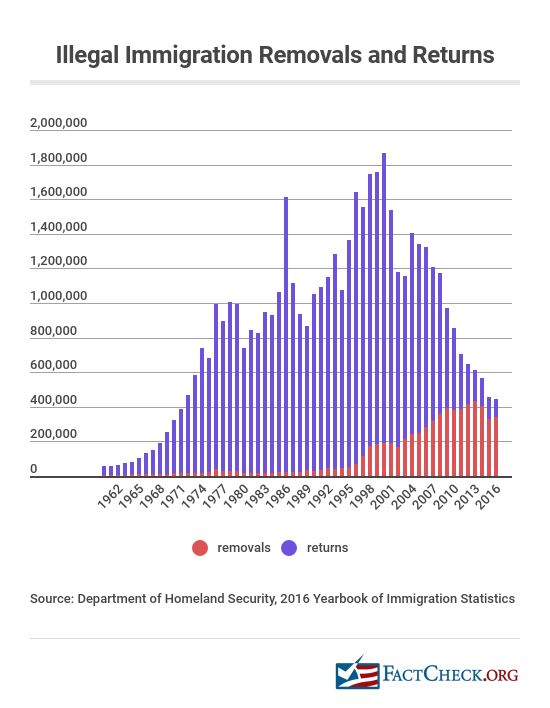
The Immigration Act of 1965 changed the immigration picture in the U.S., allowing a huge increase in immigration, this time dominated by Hispanic immigration (mostly from Mexico), and secondarily, Asian immigration. This was accompanied by a huge increase in illegal immigration, again mostly Hispanic.
The Capital:Labor ratio in the U.S. changed dramatically.
There is a good website called WTF Happened in 1971?, that looks at some of the changes to the U.S. economy since around 1970. The time 1971 pointedly marks the advent of floating fiat currencies in the U.S., from the Bretton Woods gold standard that preceded it. This certainly had many important consequences, which I will talk about in detail. But, the changes cannot, in my view, be ascribed to monetary factors alone. A number of things happened around that time, with the Immigration Act of 1965 certainly an important milestone; but also, the entrance of Chinese labor into the world market with the liberalization of China beginning in 1978.

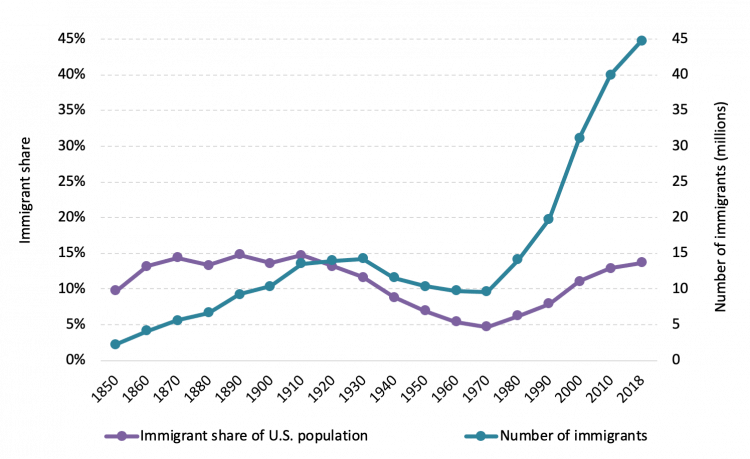
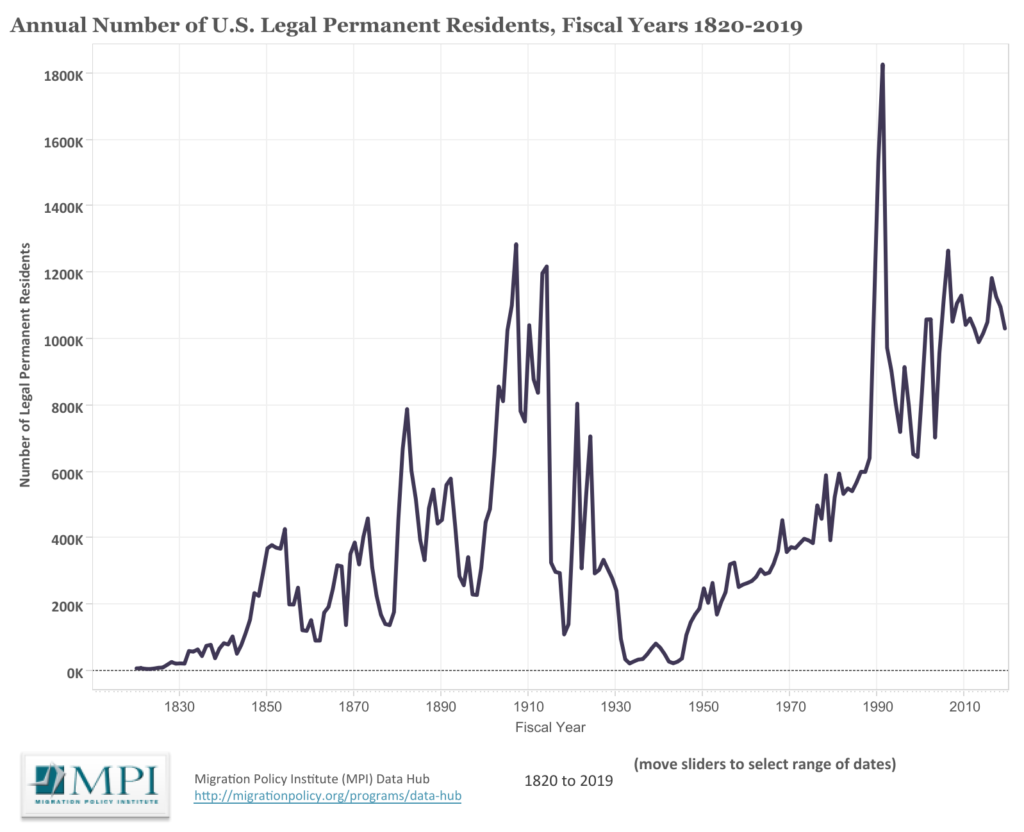
I think we could look at U.S. history as having three big immigration booms. The first was the 1830-1860 boom. Arguably, this could be seen as one long ramp into 1920, but the presence of the Civil War in the middle tends to split it in my mind. Then, there was another boom in 1870-1920. A third boom began in 1965.
There seems to be a pattern here, of Labor becoming scarce relative to Capital. Each of these immigration booms began with a period of prosperity and rising wages. Capital was becoming plentiful; Labor becoming relatively more scarce. Basically, Capital (business) went looking for cheaper labor.
