
I’ve been continuing my catch-up on the state of all things taxation with An Inquiry Into the Nature and Causes of the Wealth of States (2014), by Arthur Laffer, Stephen Moore, Rex Sinquefield, and Travis Brown. I am somewhat embarrassed to say that I haven’t gotten to this until now, although I bought the book some time ago and have had it standing by.
This is a good book. It has the kind of practical approach — a “what the heck is really going on here” stance — that I find very refreshing. A lot of academic work is really inside-baseball maneuverings within the context of winning points for tenure-track job advancement, with little relationship with the real world. The fact that Laffer has been a stock-market watcher (Laffer and Associates) for big institutional investors for a long time helps here. Also, Stephen Moore comes from the practical side of public policy, and information that can help form public policy — that is, stuff that makes sense outside of the insular world of academic mud-wrestling.
Usually, it is rather hard to measure very precisely the effects of some kind of change in tax policy. There are simply too many other factors involved, too much going on, too much noise in the data. A tax reform might increase the average economic growth rate by 1% per year over ten years. That’s actually a lot — the economy would be 10% larger after ten years that it would have been otherwise. For the last ten years, the U.S. economy has averaged about 1.6% per year, with most of that coming from population growth, about 1%. So, to go to 2.6% would mean almost a tripling of the growth rate per capita. A 10% larger economy would mean an additional $1.9 trillion or so of GDP every year, and since tax revenues are about 28% of GDP, it would mean an additional $530 billion per year of tax revenue, year in and year out, for the U.S. as a whole. But, economic statistics are not very good as they are — U.S. statistics show much more growth during the 1970s than really happened during that “malaise decade,” for example. Even if there was a measured increase in GDP growth by 1% per year in the official statistics, people would attribute it to all sorts of things.
1% per year of increased growth is pretty powerful just by itself. I think that much more than this is possible — an additional 10% of growth per year has certainly been achieved.
To do the same kind of analysis for the states would seem like an even more difficult task. The changes in tax policies are rather more subtle. We are talking about a few percentage points differentiating a “low tax” state with a “high tax” one. Laffer et. al. hit upon the excellent idea of comparing states with one another, typically via rankings. Since all the states are experiencing the same national-level economic conditions, comparing one with another, or one with national averages, should cancel out this overall variability, and help identify what influence state-only tax policy has. Also, using percentages of the U.S. total, or rankings (instead of raw numbers) expresses “winners and losers” more clearly. People can move from state to state readily, while moving from one country to another is difficult. This makes tax competition all the more acute.
The data is somewhat clouded by issues relating to energy — Alaska, North Dakota and Wyoming all had big windfalls related to oil and gas production. So, the authors did some numbers that exclude the states with high revenues from oil and gas. The seven remaining states with no personal income tax were compared with nine high-tax states.

We can see that the low-tax states had more personal income, more growth, and population inflows. You could argue that most of the gains were from population inflows — larger GDP is mostly in line with larger population. But, what’s wrong with that? It means that low tax states created new businesses and jobs, while high-tax states lost businesses and jobs. People don’t necessarily bring their productivity with them when they change states. Rather, Laffer found that, as the unemployed and underemployed left a high-tax state, potentially for the expanding businesses and proliferating job opportunities of a low-tax state, per-capita GDP actually went up. Population was shrinking faster than business and income was shrinking. I was surprised to find that California has had such consistent outflows of population, especially with the talk of “housing shortages” in recent years. It would be interesting to see California’s numbers since 2012. Personal income was about 10% higher in the low-tax states, after ten years, and Gross State Product about 8% higher. In other words, the difference between the high-tax states and the low-tax states was roughly 1% per year.
Another comparison was made between eleven states that had previously been income-tax-free, and then introduced an income tax after 1960, and all other states.
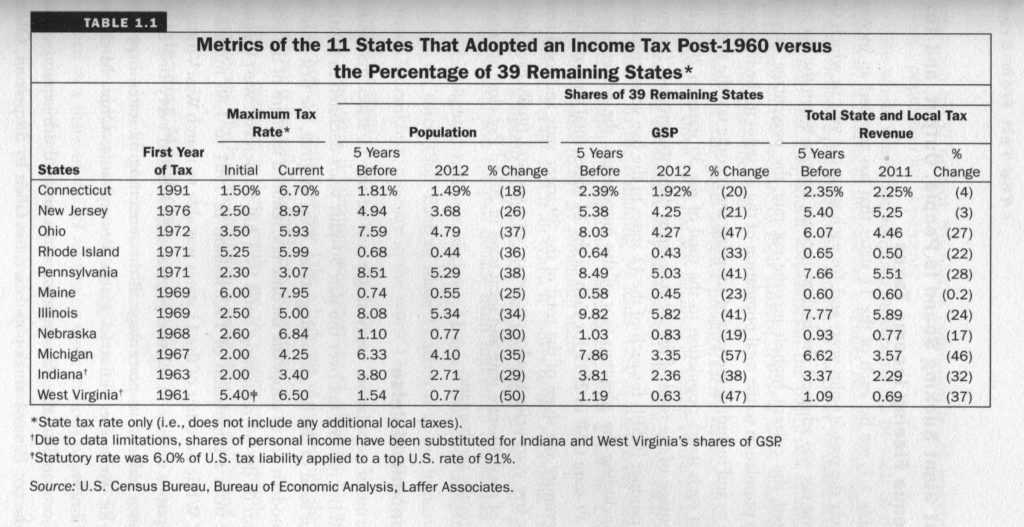
Here we see big declines against what happened in the 39 other states. The population of Connecticut fell 18% relative to the 39 other states; Michigan fell 35% and Illinois fell 34%. Gross State Product fell 20%-40%+ relative to the other states. Tax revenues, not surprisingly, were disappointing.
“But,” Leftists might argue, “the higher taxes pay for more and better government services!” The population migration numbers seem to suggest that people will take low taxes over any increased services that might arise from higher taxes. But, since the higher taxes don’t actually create more revenue — look at the negative numbers in the table above — you obviously can’t spend more on services. (Not that spending more necessarily means better anyway.) The authors did a survey of public services — education, healthcare, police, welfare and highways — and found that the high-tax states were no better than the low-tax states. There was a consistent pattern of services costing more in high-tax states, however. A comparison was made between Texas and California. Low-tax Texas had 344.6 people working in education per 10,000 population. California had 231.1 people. It would be hard for California to beat Texas with this kind of handicap, so it is no surprise that Texas ranked 29th (out of 50) on standardized NAEP test scores, and California ranked a wonderful 47th. It is strangely no surprise to learn that educators in California make 40% more, however. Texas also had better highways, better prisons, better welfare systems, and so on and so on.
So there you go. The differences were, in a sense, somewhat subtle — in the rough neighborhood of 1% per year, or maybe less. But, over the years and decades, they add up to big outcomes. Higher taxes — in this case, mostly income taxes, although the authors also discuss sales taxes and total “tax burden,” or revenue/GDP — did not produce more revenue, nor did they produce improved government services. They were all downside and no upside.
I have been making the case that the “Fair Tax” (unified sales tax) people should not be focusing on the Federal government, but rather on State governments. A large body of tax research, and a broad consensus, has formed around the idea that the least destructive and most effective way to raise revenue is with broad-based consumption-type taxes. Actually, people have found that sales taxes don’t work well with rates over 10%. That is why most national governments have gone to VAT-type taxes. That would be difficult on the state level. Certainly, if you are going to argue that States would be better off without income taxes, you are also making the implicit argument that they should be more reliant on sales taxes, and other consumption-based taxes like alcohol, tobacco or gasoline taxes.
All in all, great work by Laffer and crew.
