
I’ve been working on a new book, The Magic Formula, which I hope will be out before the end of the year. It is an introductory book, aimed at people who have no prior experience in these matters. This section of the book describes Ireland in the 1980s and 1990s.
Ireland
Ireland had been one of Europe’s poorest countries for more than two centuries. It continued as a stagnant underperformer in the 1950s, 1960s and 1970s, stumbling even behind Britain, itself a laggard. Already-high tax rates were exacerbated by inflationary bracket creep in the late 1970s and early 1980s. The poor economy led to chronic budget deficits. In 1979, as Margaret Thatcher surged to victory in Britain, an estimated 750,000 people in Ireland (from a population of 3.4 million) took part in a demonstration in favor of lower taxes. Nevertheless, in the early 1980s, the government attempted to remedy these deficits with still higher taxes – “austerity.” Central government tax revenue increased from 27.5% of GDP in 1979 to 34.3% in 1986. Unemployment soared from 7% to 17% alongside, leading to an increase in transfer payments (welfare payments) of over 7% of GDP. (Economists once called these sorts of automatic spending increases a form of “stimulus” known as “automatic stabilizers.”) The debt/GDP ratio continued to climb. By 1984, as other governments around the world (including Britain) embarked on major reductions in tax rates, further tax increases were not seen as a viable solution for Ireland’s debt and deficit problems.
In 1986, the government’s debt/GDP ratio was 116%. The deficit was 10.9% of GDP. The country was close to crisis. Charles Haughey, Ireland’s newly-elected prime minister, had a history of big spending – his spending policies while in office 1979-1982 were cited as one cause of the crisis. But in 1987, Haughey began a major program of spending reduction, “dictated by the sheer necessity of economic survival.”
In 1987, health expenditures were cut six percent; education seven percent; agricultural spending eighteen percent; roads and housing eleven percent; the military seven percent. An environmental bureau was eliminated, along with the National Social Services Board, the Health Education Bureau, and the Regional Development Organizations. Public sector employment fell by nearly 10,000.
In 1988, government spending saw the biggest reductions in thirty years. Real current spending was reduced by three percent, and capital spending by 16 percent. The primary deficit was eliminated, and the debt/GDP ratio began falling from its 1986 peak. Government spending declined from 49.4% of GDP in 1985 to 39.0% of GDP in 1990. The government’s deficit fell to 3.40% of GDP in 1990. In 2000, government spending was 30.3% of GDP, one of the lowest in Europe.
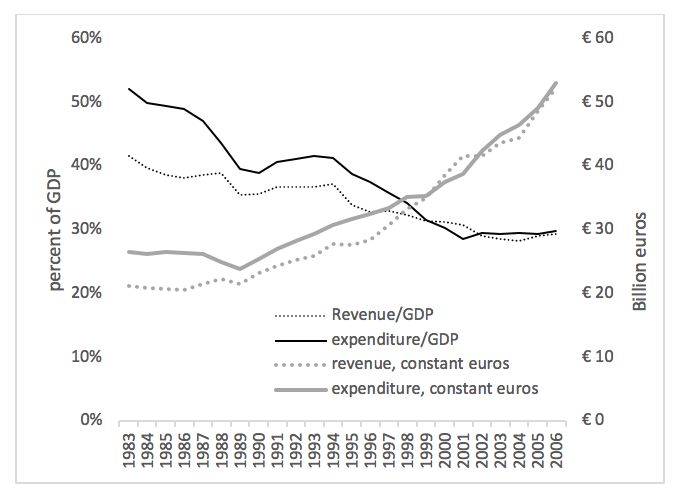
Ireland: Government Revenue and Expenditure, 1983-2006
Along with this, taxes were reduced. The top income tax rate of 65% in 1985 fell to 56% in 1989, 46% in 1995, and to 42% in 2001. The standard rate fell from 35% in 1989 to 27% in 1994 and 22% in 2001. The corporate tax rate of 50% in 1987 fell to 48% in 1988, 42% in 1989, 40% in 1991, and 24% in 2000. In 2003, Ireland introduced a 12.5% corporate tax rate, which soon made Ireland a preferred domicile for corporations operating in the European Union. In part because so many corporations chose to domicile there, revenue/GDP from the corporate income tax was three times higher in 2006 (3.62%), with a 12.5% rate, than it was in 1986 (1.21%), with a 50% rate. A combined payroll tax rate of 20% in 1990 fell to 12.8% in 2002. The capital gains tax rate fell from 60% in 1985 to 20% in 1998. The VAT rate fell from 25% in 1985 to 21% in 1993. Tax revenue/GDP fell from 38.1% in 1986 to 29.4% in 2006.
After centuries of stagnation, the Celtic Tiger began to roar. GDP growth rates rose to the four percent range in the late 1980s. By the late 1990s, they were around eight percent, and continued around five percent into the 2000s. In 1991, Germany’s per-capita income was twice that of Ireland. By 2004, Ireland surpassed Germany, to become one of the wealthiest countries in Europe. In 2006, government debt/GDP had fallen to 22%.
Ireland’s “declines” in spending/GDP, or tax revenue/GDP, were actually, in nominal terms, increases. In only one year (1988) did nominal spending actually fall, by 1.25%, and that was due to a decline in the capital budget. The current budget grew 1.0% that year. Growing GDP, and growing tax revenues along with it, allowed the government to increase its spending from €13.05 billion in 1986 to €56.15 billion in 2006, even as the spending/GDP ratio fell. Adjusted for inflation, spending rose 98% during this time.
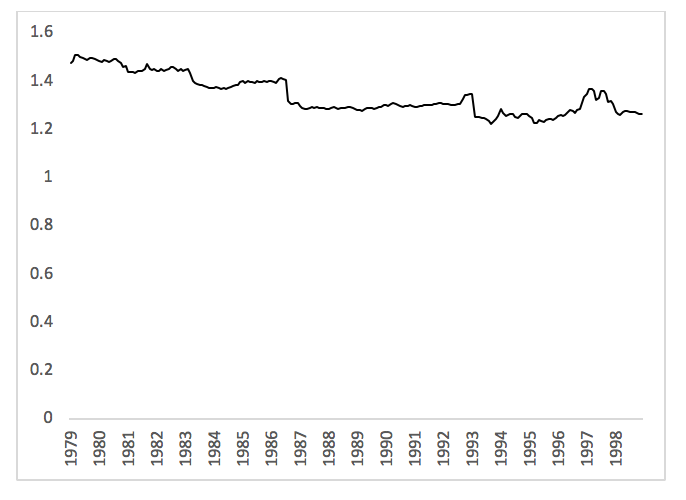
Ireland: Irish pound vs. ECU benchmark, 1979-1998
The Irish pound was linked to the British pound until 1979, when Ireland began to participate in the European Monetary System. From 1980 to 1986, under the pressures of high unemployment and a weak economy, the Irish pound declined gradually against the European Currency Unit benchmark. After a last minor devaluation in 1986, the Irish pound remained stable, within the context of the EMS which mandated fixed exchange rates. This closed off currency devaluation or debt monetization as viable alternatives. In this, Ireland showed more discipline than Britain, which left the EMS in a crisis in 1992, devaluing the pound as a result. In 1999, Ireland adopted the euro.
Ireland cut spending – ultimately, by an amazing 19% of GDP over fourteen years — cut taxes, and kept the money stable. The Magic Formula turned a generational underachiever and default candidate into a powerhouse.
