
We’re building up a little narrative of the latter 1960s, the leadup to the demise of Bretton Woods in 1971.
“Money Printing” in the 1960s Series
Today, we will just look at interest rates of that time, as things were getting out of hand.
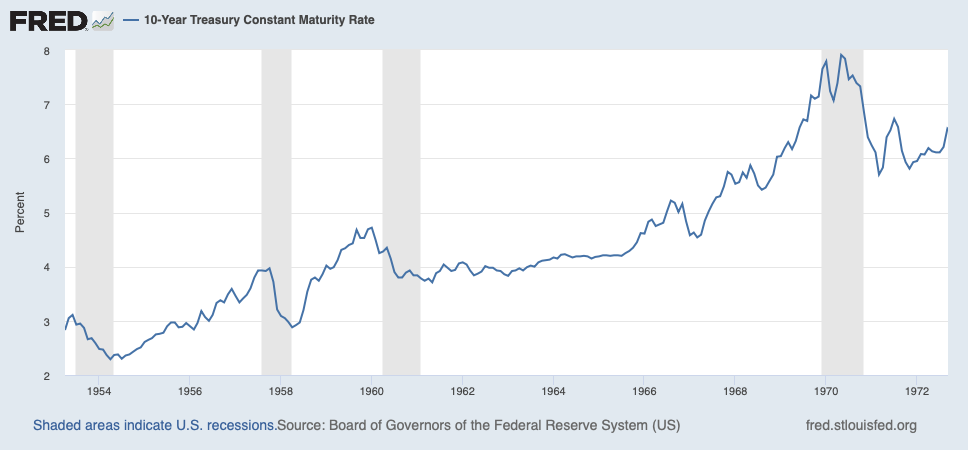
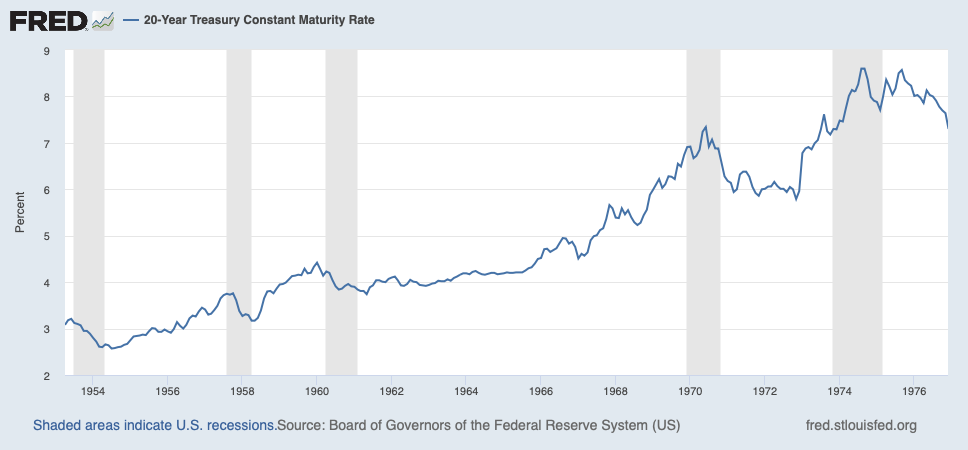
Here is the monthly 10yr Treasury Yield. The yield was very low coming out of WWII, due to extreme risk-aversion. It rose a bit as the economy expanded, although the 1950s were actually quite difficult with four recessions in a decade. Going into 1960, the dollar was rather weak, and the open-market price of gold was said to have hit $40/oz. (from its $35/oz. parity). But, the election of the Sound Money-favoring Kennedy in 1960, the good management of Bill Martin at the Fed, and the dollar-positive effects of a trend toward lower taxes, helped stabilize both the dollar and interest rates during the Kennedy years.
Johnson, however, was plainly pressuring the Fed for an easier stance. We will look into the nature of this “pressure” later. Here, from the Richmond Fed, is an account of the battles between Johnson and Martin:
1965: The Year the Fed and LBJ Clashed
Also, I think the Fed itself adopted the precepts of Monetarism sometime in the early 1960s. This basically amounted to a policy of maintaining a stable growth rate of the monetary base, in line with nominal GDP. Friedman himself proposed a Constitutional Amendment (!) mandating a steady growth rate of 3-5%.
The amendment specifies that, “Congress shall have the power to authorize non-interest bearing obligations of the government in the form of currency or book entries, provided that the total dollar amount outstanding increases by no more than 5 percent per year and no less than 3 percent.” (Free to Choose, p. 308).
This was a total failure, so the Friedmanites later embraced M2 and similar measures, rather than the monetary base. Today’s “Third Generation Monetarism” or “Market Monetarism” mandates a steady growth rate in nominal GDP. But, the 1960s version was the growth rate of the monetary base.
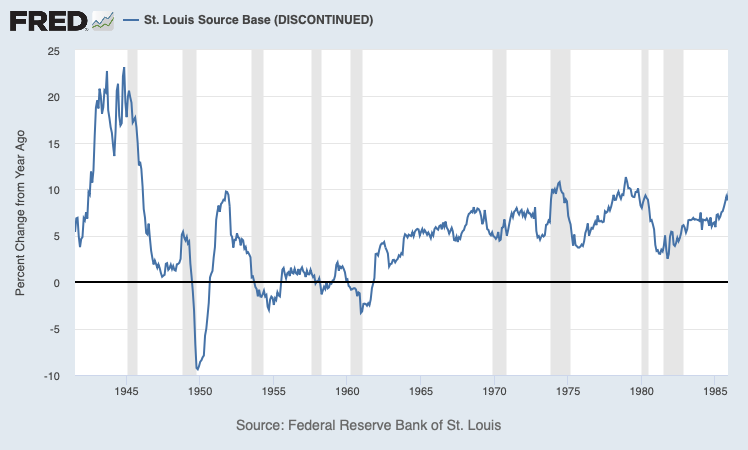
And we see that, in fact, the Federal Reserve did expand the monetary base by a suspiciously stable number, around 5%, beginning in 1964.
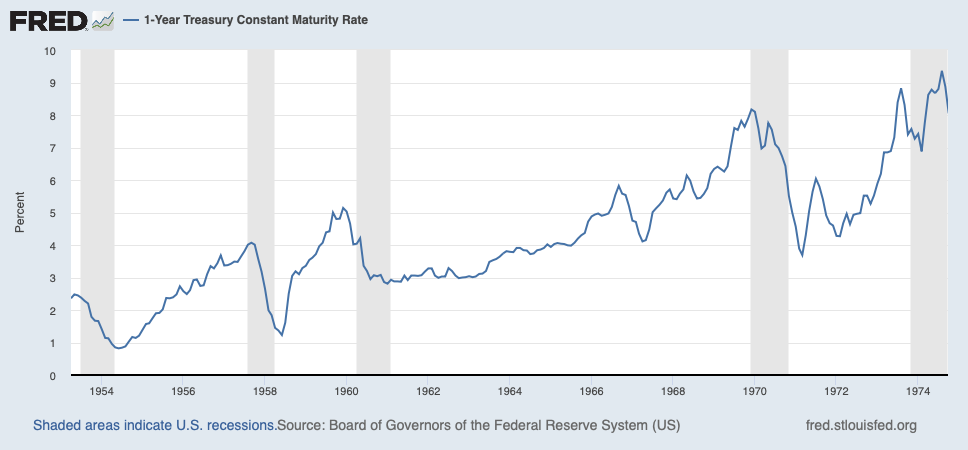
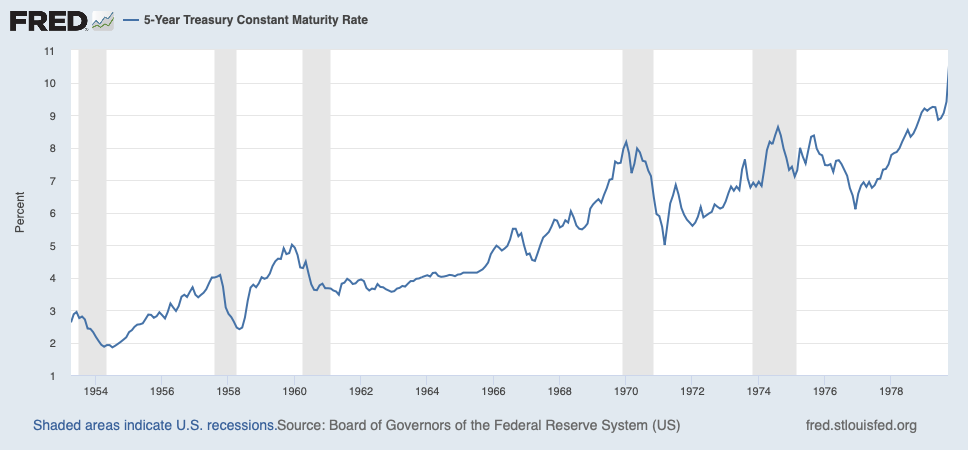
Back to interest rates. Here are more points along the Treasury curve.
In the Effective Federal Fund Rate, we can see an effective ceiling on the rate (although not a clear floor).
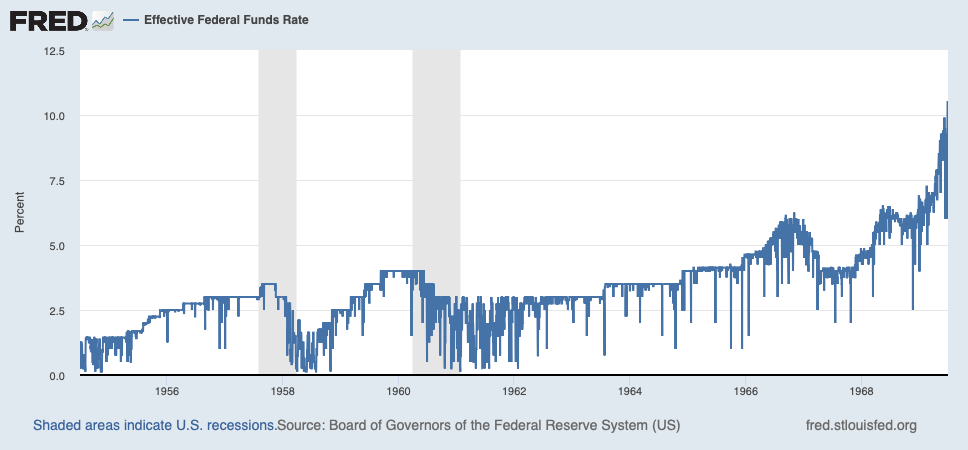
This becomes a lot more vague in 1966, again suggesting a turn toward Monetarist ideals, which do not target interest rates. Remember, the Federal Reserve did not have an official Fed Fund Rate target until 1994!
May 23, 2021: Targeting Interest Rates
So, when we see these higher interest rates, it is not because the “Federal Reserve raised its interest rate target.” Rather, it was following Monetarist models, which ignore interest rates. But, I am sure they had their eye on them too.
So, we see a little jump across the yield curve in 1966, which seems to be related to a higher Fed Fund Rate (that is, the rate at which banks would lend to each other).
Already, by 1966, there was, I think, a plain tendency toward inflationism with Johnson and the compliant Federal Reserve. Naturally, interest rates rose. Remember, there were a number of devaluations in 1967, including Britain, Denmark and Finland, which basically arose from overly-easy domestic monetary policies overwhelming stated exchange rate parity policies. And wasn’t the US doing the same thing? People naturally assumed a devaluation, and wanted to get paid for the risk. Also, the US economy was doing very well at this time, a result of the big 1964 tax cut, which probably tended to push rates a little higher.
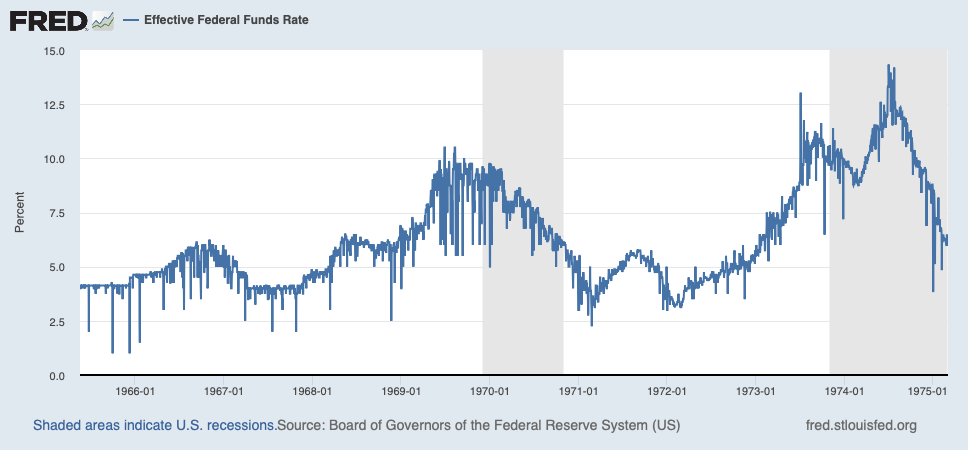
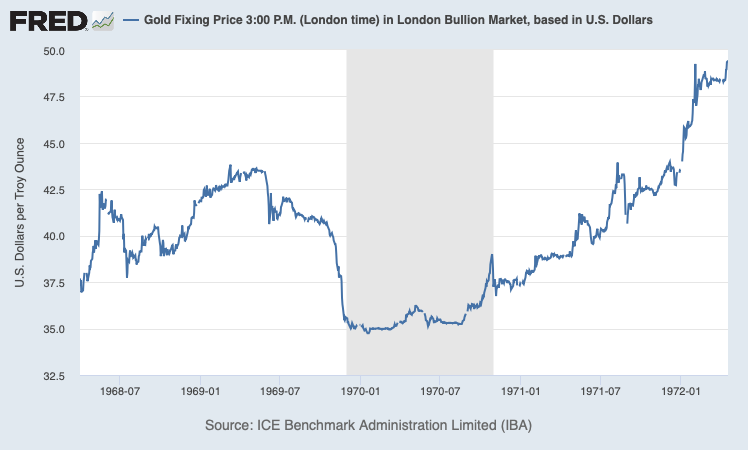
But, things really got serious in 1968, with the collapse of the London Gold Pool, and the collapse of the dollar from its $35/oz. parity to levels around $40-$42/oz. This was a big decline — in effect, almost a devaluation, but it wasn’t official. There was a chance the Fed would fix the problem, and in fact the Fed did fix the problem in 1969-1970. Gold convertibility ceased.
We see the initial break in 1968, a little recovery, and then another weak-dollar move in 1969.
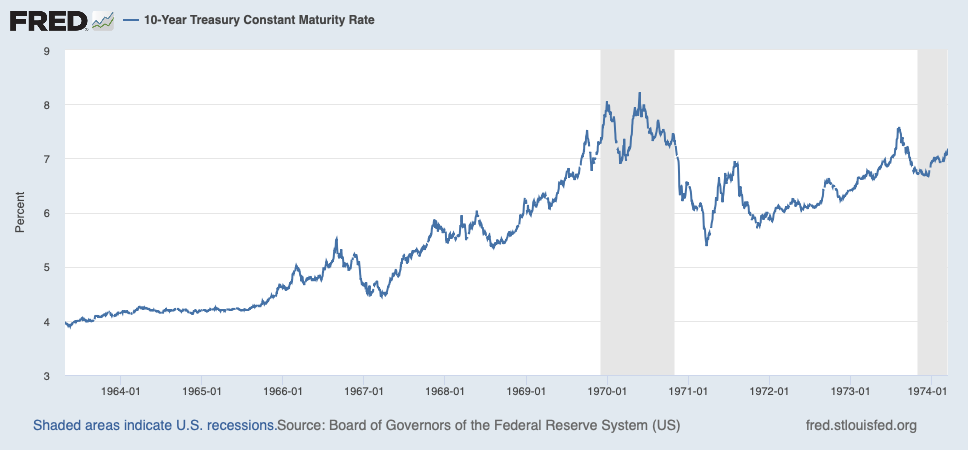
The 10-year Treasury yield follows this curve, vomiting higher in 1968 with the breakdown of the London Gold Pool, and then surging higher again in 1969.
In 1969, things were really bad. The Fed Funds Rate was around 9%, about its highest since the Fed’s creation. The ten-year bond was at 7%+, again the highest since about 1880. France devalued in 1969. People were gearing up for a devaluation of the dollar. In 1970, Harry Browne published a popular book called:

If the dollar was going to continue at its $35/oz. Bretton Woods parity, then you could have made major coin by buying 20-year Treasury bonds paying 7%+. Bill Martin did indeed reel in the dollar, at the end of 1969. If the dollar had been kept at its $35/oz. parity, and it looked like it would stay there, interest rates would have certainly fallen back to their 1960-1965 levels around 4% on the 10yr Treasury bond — as happened after 1960, when Martin successfully resolved the dollar weakness of that time. But, January 1970 was the last month of his term, and everyone knew it. Arthur Burns was named Martin’s successor in October 1969. Those who bet on an eventual devaluation were correct.
Now, the way this looked to to the Nixonites is that the Fed was allowing the highest interest rates in its history back to 1913; and also, the big rise in the dollar in late 1969 was another potentially recessionary factor. Nixon had already blamed the Fed — and Bill Martin specifically — for not allowing lower interest rates in 1960, which Nixon thought cost him the close election with Kennedy that year. 1960 was also a recession year. The 4.0% top Fed Funds Rate of 1960 was not very high, but it was actually the highest in over 20 years.
This was, of course, related to the weak dollar ($40/oz. gold) at the time, in 1960.
So, from Nixon’s standpoint, it was eerily similar. Recession in 1960 and 1969. Bill Martin at the Fed causing very high interest rates, obviously leading to economic difficulties. Both times, this was related to a weak dollar (vs. gold), and Martin’s somewhat clumsy but successful efforts to return the dollar to its $35/oz. parity.
Nixon was also reneging on his campaign promises, and raising taxes. The 1969 recession was the result. Nixon had his eye on the 1972 election, and hand-picked Burns to deliver the easy-money juice to make it happen. This included much lower interest rates, which Burns delivered.
So, there was an unfortunate political cycle where easy-money policies led to higher interest rates in anticipation of a devaluation; higher interest rates led to a weak economy; the weak economy and higher interest rates led to pressure on the Fed from both Johnson and Nixon for even easier money, thus raising devaluation fears. If both Johnson and Nixon had just left Martin alone, and let him and his successors keep the dollar at $35/oz. as he had successfully done since 1951, then interest rates would have fallen to moderate levels, and the economy would have boomed.
