
I was going to do something on the last years of Bretton Woods, involving William McChesney Martin at the Fed, and Presidents Johnson and Nixon. But, to do this properly would take some serious research, which I never got around to. (It would make a nice book.) So, today — the fiftieth anniversary of the official End of the Bretton Woods system on August 15, 1971 — we will instead take a step-by-step approach, piecing together little clues along the way.
As I have described in my books, the final breakup of Bretton Woods in 1970-71 had to do with the end of Bill Martin’s term at the Fed in January 1970, and his replacement by Arthur Burns, who was hand-picked by Nixon for his “easy money” strategy.
However, there is the idea out there that the breakup of Bretton Woods had something to do with the Fed “printing money” to fund Vietnam and Great Society spending in 1967-68. I have found that there is actually a lot to these claims, which we will look into.
At the surface, it doesn’t make much sense. Deficits in the 1960s were quite small, existing Federal debt/GDP was low, and there was hardly any reason for the Federal Reserve to finance the government with printing-press finance. In practice, there is not much evidence that the Fed did this. Its monetary base growth statistics are very modest, and in line with what one would expect for the growing economy of that time.
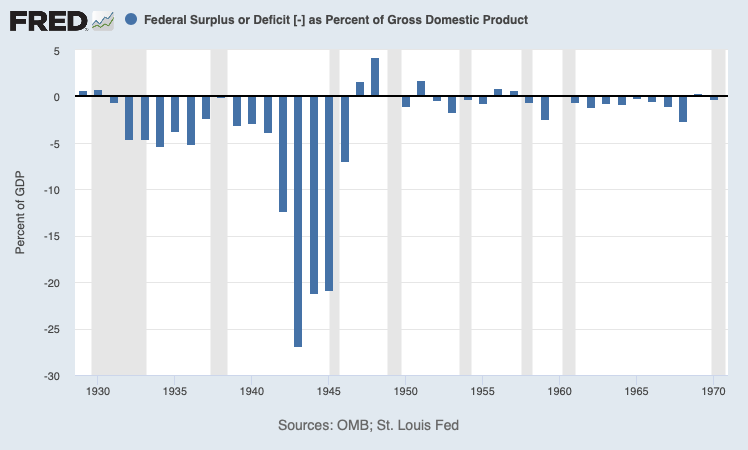
The biggest deficit/GDP of the 1960s decade was in 1967, of 2.67% of GDP. Most of the time, the deficit was under 1%.
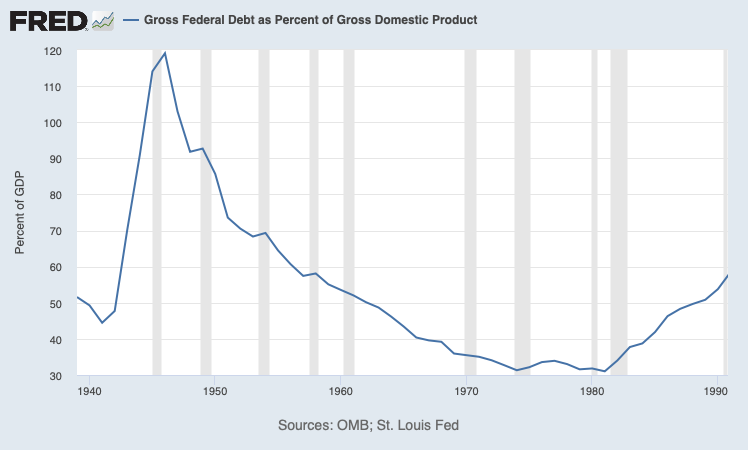
With modest deficits and rising GDP, the debt/GDP ratio had fallen to low levels in the 1960s. There was no need for desperate measures. Just sell a few more bonds. Who cares.
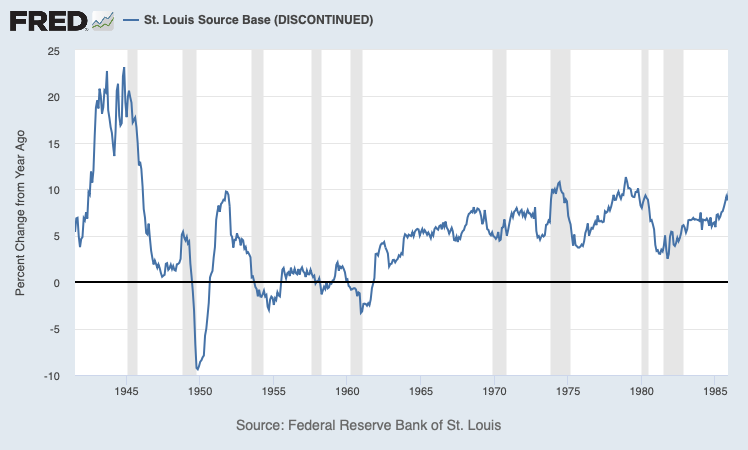
The growth rate of the monetary base (Fed balance sheet) was around 5-7% in the 1960s, in line with an economy where nominal GDP was also growing around 5-7%. It doesn’t exactly say: “wild money-printing.”
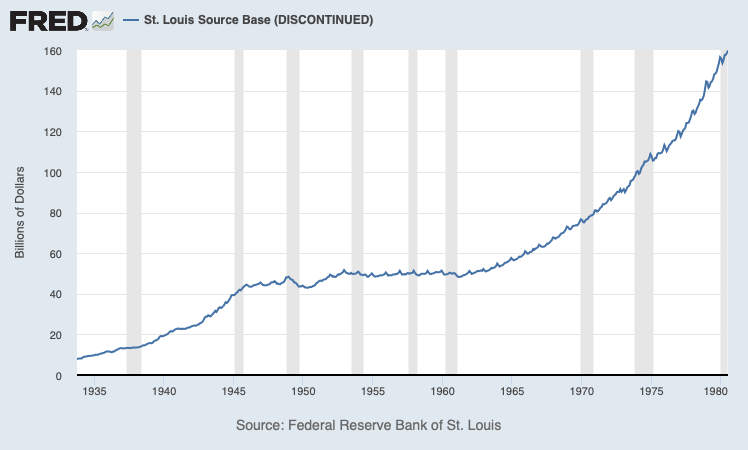
This is what it looks like. A smooth curve of expansion, roughly in line with nominal GDP.
But, let’s look at the expansion of the monetary base, in terms of dollars.
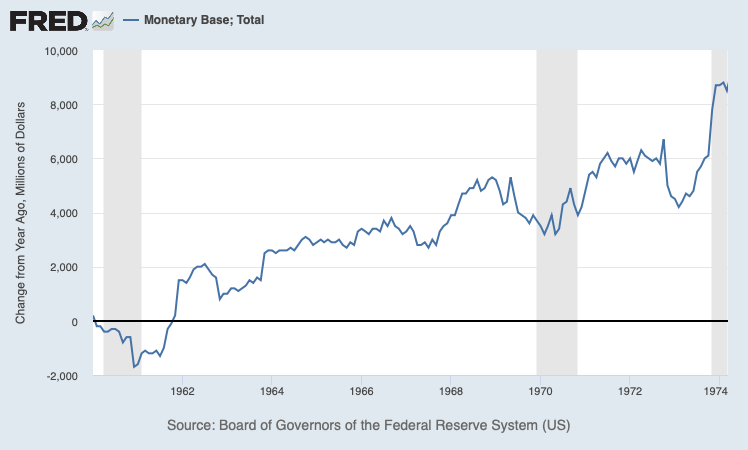
This smooth expansion meant “printing money” at a rate of about $3 billion a year, in the mid-1960s. There was a pretty big step-up to $5 billion/year around 1968.
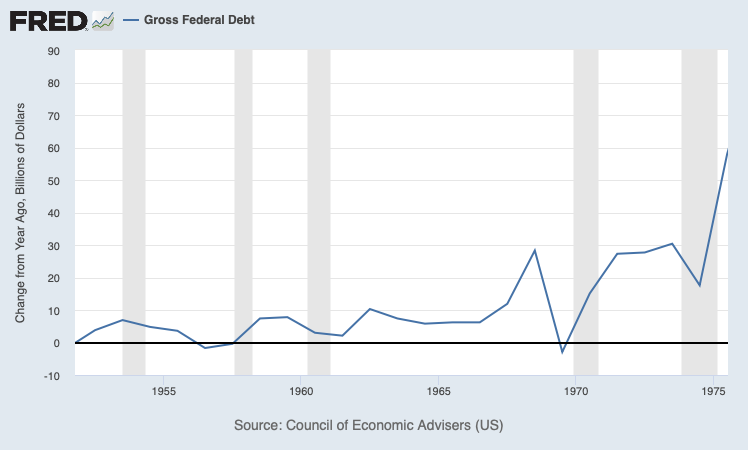
If we look at the expansion of Gross Federal Debt (the Social Security Trust Fund was not a big deal in those days), it was $6.2 billion in 1965, rising to $28.3 billion in 1967.
So, we find that the Federal Reserve was actually financing about half the Federal deficit in 1965, via “money printing.” This was because the deficit was pretty small.
The big step-up in Federal Reserve monetary expansion in 1968 was, I think, related to direct pressure on the Fed by the Johnson administration. So, although the numbers were small, nevertheless observers saw the Fed caving to Johnson’s demands to step up the money-printing to finance the big Guns and Butter budget of 1967. It was not so much the rather modest increase in the monetary base (of about 2% a year), but the decline in demand as people figured out (correctly) where this was going, that drove the weak dollar crisis of that time.
Already, Britain had devalued the pound in 1967, and France devalued in 1969 — basically, as a result of domestic “easy money” policies that overwhelmed currency pegs. So, it was not a very big stretch to guess that this “easy money” pressure on the Fed would also result in a devaluation. The Danish krone and Finnish markka were also devalued in 1967, which probably didn’t improve confidence much. Were central bankers all a bunch of clowns? (Yes.) The result was the breakdown of the London Gold Pool in 1968.
Wikipedia on the breakdown of the London Gold Pool.
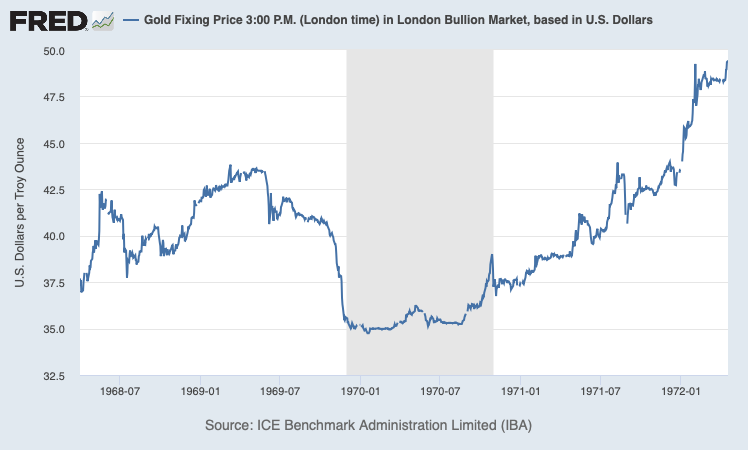
With the breakdown of the London Gold Pool, the US dollar floated against gold. The dollar’s value fell to around $43/oz., a pretty big deviation from the $35/oz. Bretton Woods gold parity. Along with this, the “gold window” was effectively closed at the Fed. No longer could people (mostly foreign governments and central banks) trade $35 for an ounce of gold at the Fed.
When Nixon announced the “closing of the gold window” in August 1971, he was just making official what had been unofficial policy since 1968.
And then what? Johnson was gone in 1968/69. Nixon was in. Bill Martin at the Fed, no longer being pushed around by Johnson, was free to ease off the monetary gas pedal. The rate of monetary expansion fell back again, from around $5 billion/year to $3 billion. After all, it was Bill Martin that reeled in the dollar after the 1951 Fed Accord. He had done this before.
In 1969, the dollar/gold price jumps back to the $35/oz. parity. Mission Accomplished!
Way to go Bill!
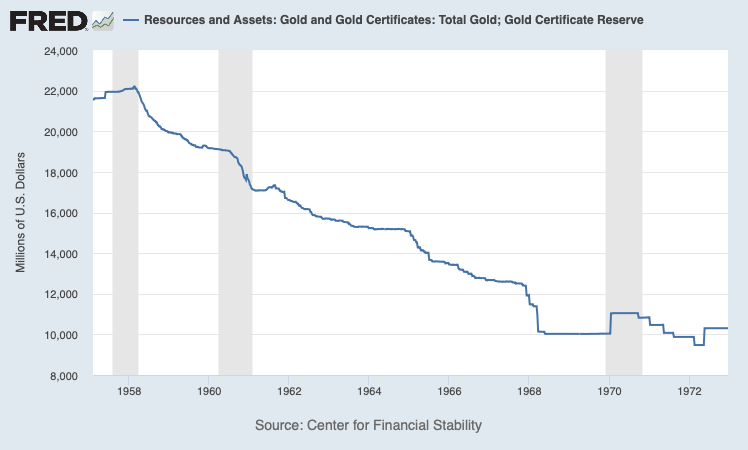
There was even a little rise in the Federal Reserve’s gold holdings, in January 1970. It looks like the Fed actually had a little gold inflow! In other words, the market value of the dollar actually rose a little beyond its $35/oz. parity (to $34.75 let’s say), which made the Federal Reserve the highest bidder on the world gold market. (The Fed was paying $35 while everyone else was offering $34.75.)
I just made up those numbers, but you can actually see this on the daily price data. The “price of gold” really did reach $34.75 in London, in January 1970.
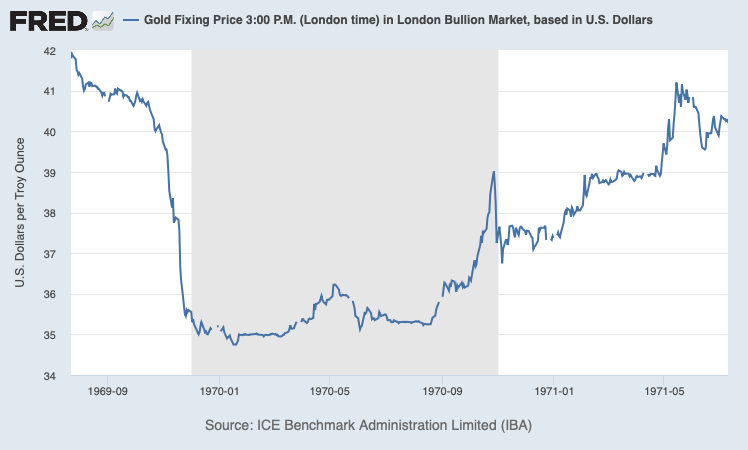
But, this required a pretty big jump in dollar value. A rise from $43/oz to $35/oz. was a 23% rise in the dollar’s value. This probably contributed to the recession of 1969-70. (It didn’t help that Nixon also raised taxes in 1969, reneging on his campaign promises.) Nixon blamed Martin for this (not without reason), and replaced him in January 1970 with Arthur Burns. Very quickly, Burns ramped up the pace of money creation from about $3 billion a year to $6 billion again. We know the rest of the story.
