
This week we will look at Net Gold Exports of major countries, 1913 to 1937. This has some importance regarding monetary “interpretations” of that time.
August 25, 2017: The Interwar Period #2: It’s Not That Complicated
The source of the data is the Jones/Obstfeld Database, available at NBER.
http://www.nber.org/databases/jones-obstfeld/
We discussed this earlier here:
August 11, 2017: The Midas Paradox #4: Much Ado About Nothing
This database is, rather inconveniently, represented in terms of national currency, not ounces or kilograms. I thought it would be helpful to attempt (note the use of the word “attempt”) to convert these into ounces of gold, for easier international comparison. The problem is that currencies were rather unstable during this whole period.
July 18, 2014: Foreign Exchange Rates 1913-1941 #8: A Brief Summary
For simplification, I made the following assumptions:
U.S.: $20.67 per oz. of gold until 1934
Germany: prewar gold/mark parity (no data for 1914-1924 in Germany)
Italy: prewar gold/lira parity until return to gold standard in 1927, then 1927 parity (ignoring 1936 devaluation)
France: prewar gold/franc parity until 1928, then 1928 parity (ignoring 1936 devaluation)
Britain: prewar gold/pound parity throughout, ignoring WWI floating pound and 1931 devaluation
Here is how it looks:
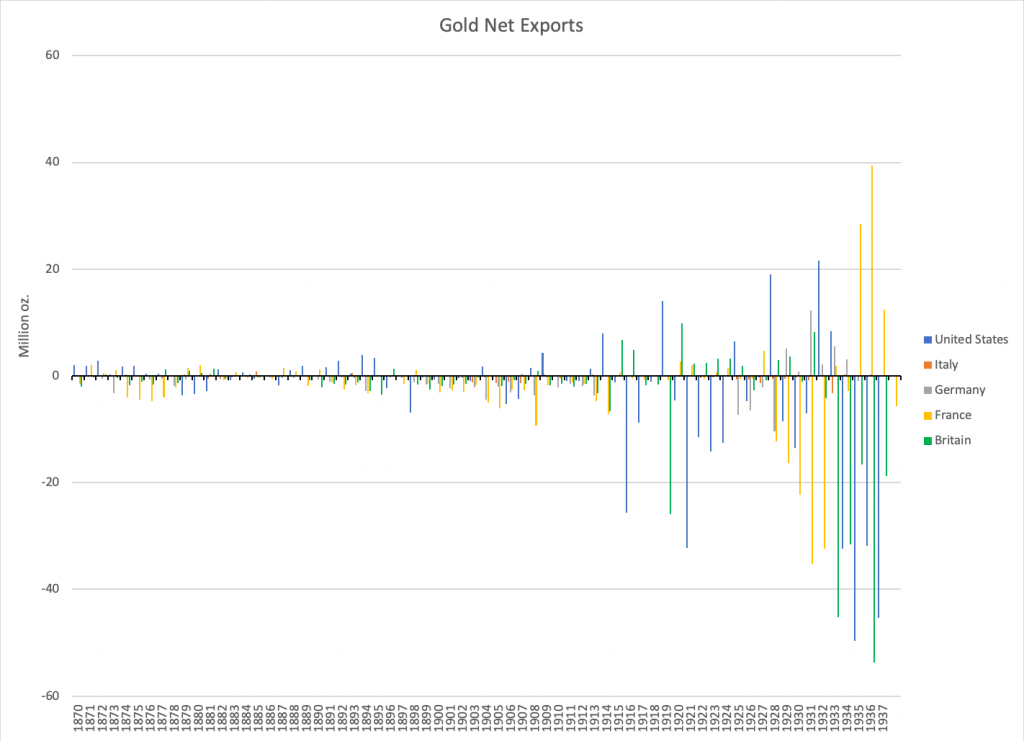
A positive “net export” is an export, and a negative “net export” is an import. We can see that gold flows became more dramatic in the later 1930s, although this is also a matter of simply larger economies. Around World War I, we see large imports in the United States, but these are not matched by exports from Europe, except from Britain to a small degree. The legends of “flows of gold coming from Europe” are a myth. But, I should mention that these are NET exports. Thus, there could be an outflow to the U.S., matched by an inflow somewhere, leaving little net export. We’ve seen already that European central banks did not reduce their gold holdings during WWI.
August 10, 2014: Gold Holdings of Central Banks and Governments, 1914-1941
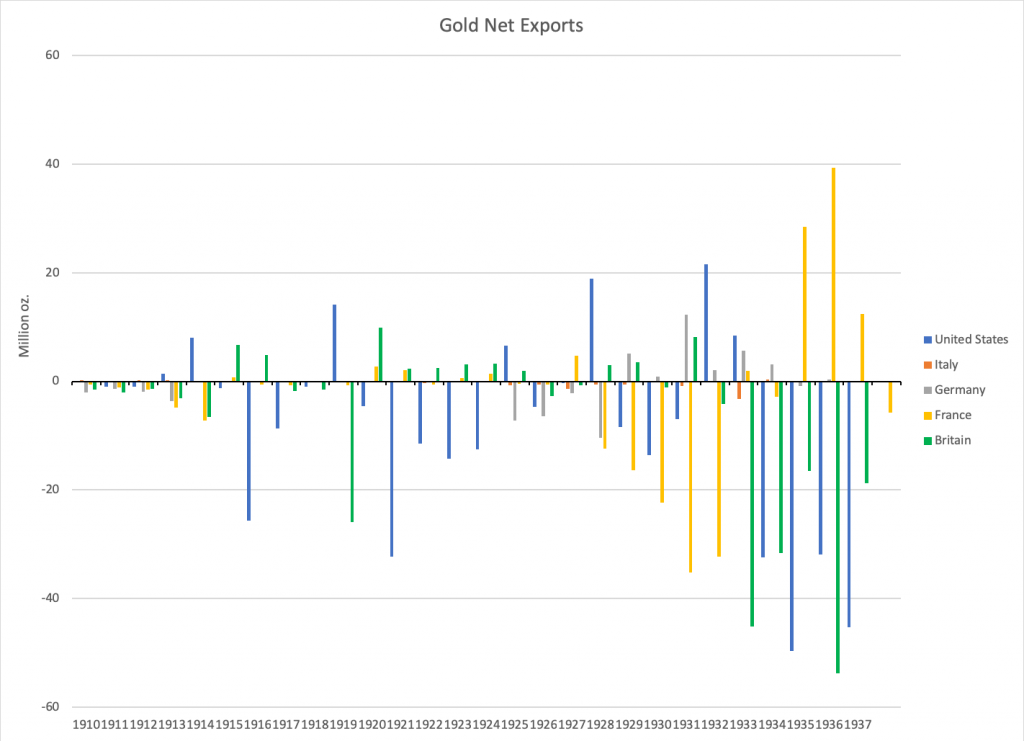
This is the same chart, just focusing on the 1910-1937 period. We see again that the “gold outflows from Europe during WWI” and “gold inflows to Europe during the 1920s” story is false. The major European countries were minor exporters of gold during the mid-1920s. This changed when the Bank of France began to accumulate gold beginning in 1928. This increase in gold holdings by the BOF has excited a generation of economists still trying to blame the onset of the Great Depression on monetary factors. We looked at it elsewhere, and basically concluded that it didn’t amount to much.
Other than the BOF issue, we have some minor gold imports in the U.S. in 1929-1931, and then a larger export in 1932. These were matched with minor exports in Britain and Germany. All in all, not a lot of evidence of “gold hoarding” here.
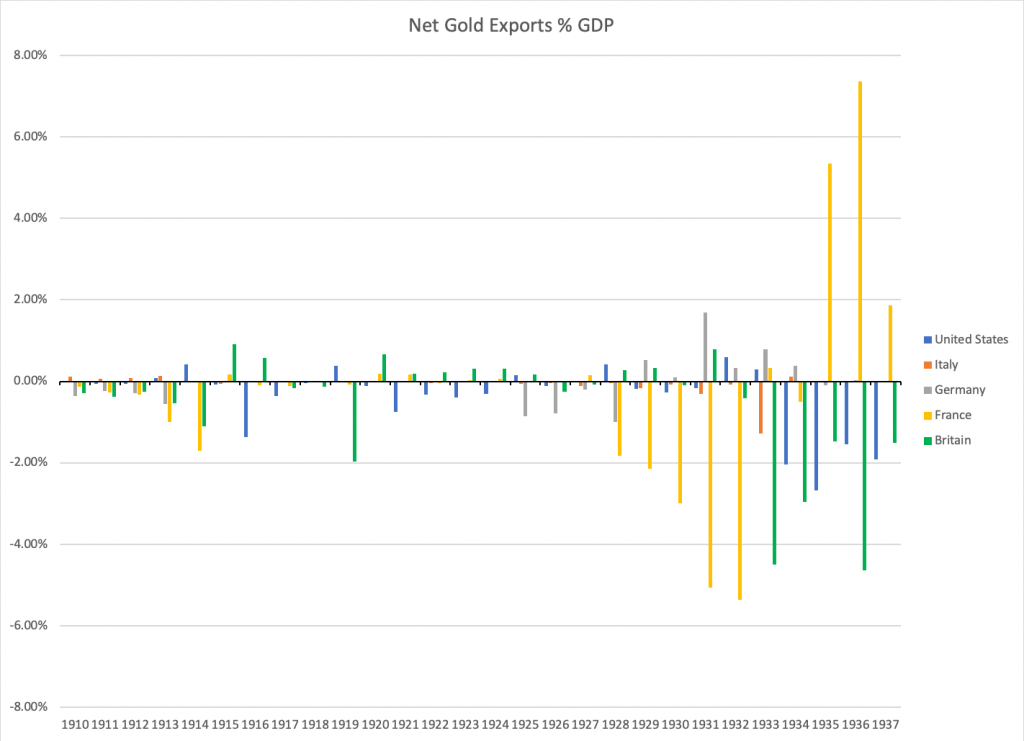
This is how it looks in terms of % of GDP. The U.S. moves now look very minor. Again excepting the BOF issue, very little evidence of “hoarding” of gold at the onset of the Great Depression.
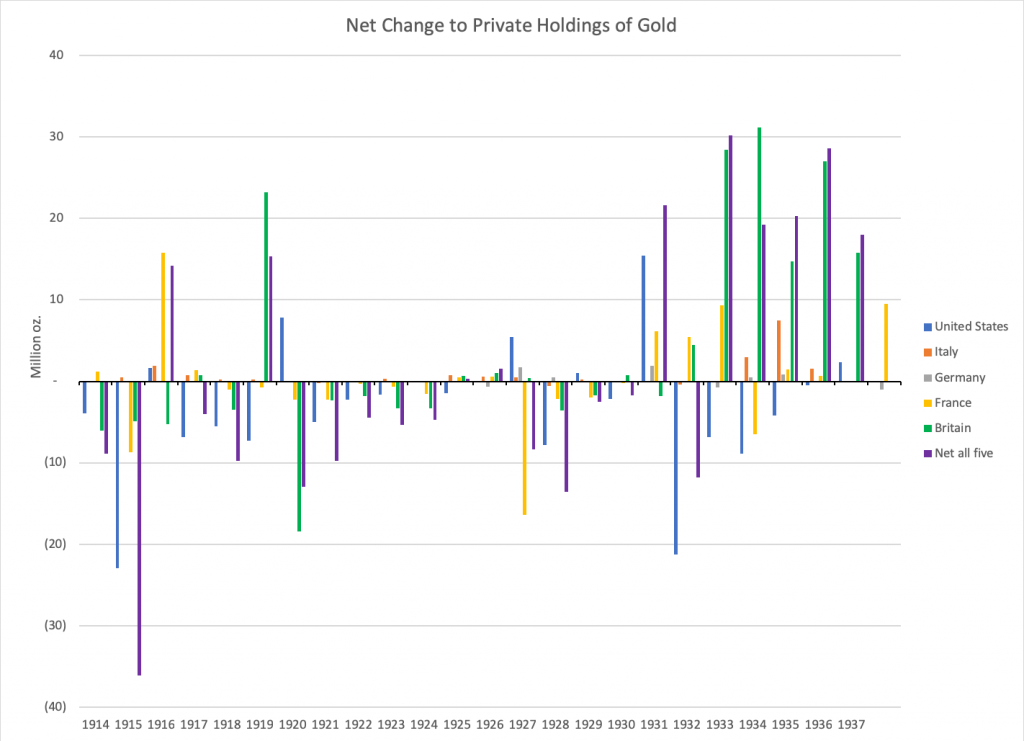
This is an attempt to gauge the scale of gold holdings by the private sector, ex-central banks. This includes coinage, bullion, jewelry etc. Basically it is Net Exports minus changes in central bank holdings, thus showing Net Exports by the private sector. I did not adjust for domestic gold production, which was negligible in Europe but meaningful in the U.S. The purple bar shows the net change in all five countries. Again there is not much going on during WWI, with most of the changes due to the U.S. The most noteworthy thing was a substantial increase in implied private sector gold holdings in the U.S. in 1931, followed by a substantial decrease in 1932 and 1933. Beginning in 1933, there were large implied private-sector gold inflows into Britain. But remember that I did not adjust the data for the 1931 devaluation, so these might be inflated by that factor. The implied increase in U.S. holdings was about 15 million ounces, or $300 million at $20.67/oz.
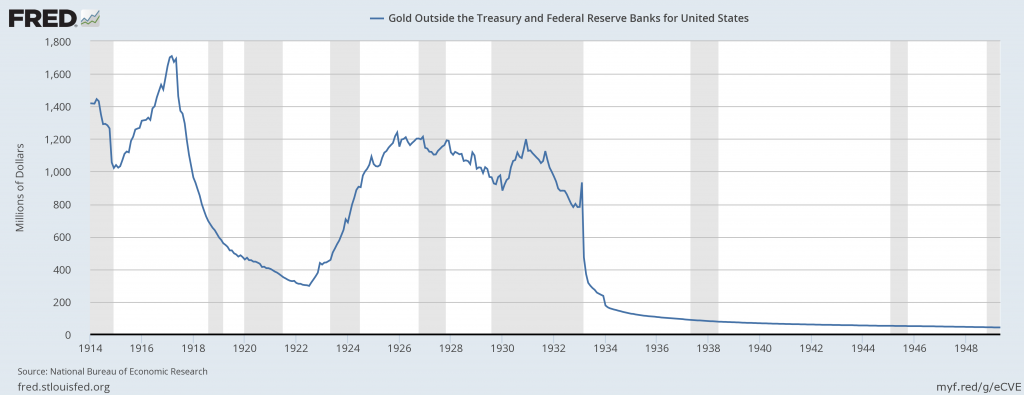
You can see the increase of about $300 million here, from $900 million to $1200 million around 1931.
However, the U.S. ended 1931 with about $5,300 million of currency in circulation, plus about $20,000 million in demand deposits at banks. So, $300 million was not really very much. It briefly brought gold outside the Fed and Treasury to where it was in 1927. Fifteen million ounces is not very much compared to 22 million ounces of gold production, or 1,499m oz. estimated aboveground gold in 1931. And, it was all reversed in 1932.
So, with all of that, I think we can dismiss “private gold hoarding” as a meaningful factor in the economic contraction of 1929-1932.
