
Some Facts About U.S. State and Local Tax History
May 3, 2015
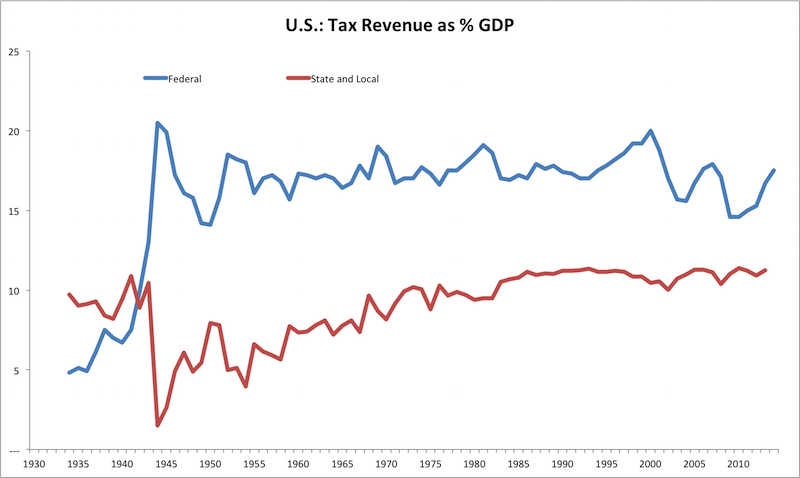
We saw last week that there has been a steady rise in general government tax revenue/GDP since 1950, which might have peaked around 2000. However, this rise came mostly from the side of state and local tax revenue. Federal revenue has been essentially flat during that time, with a slight recent trend downwards since 2000.
April 19, 2015: A Few Facts About U.S. Tax History
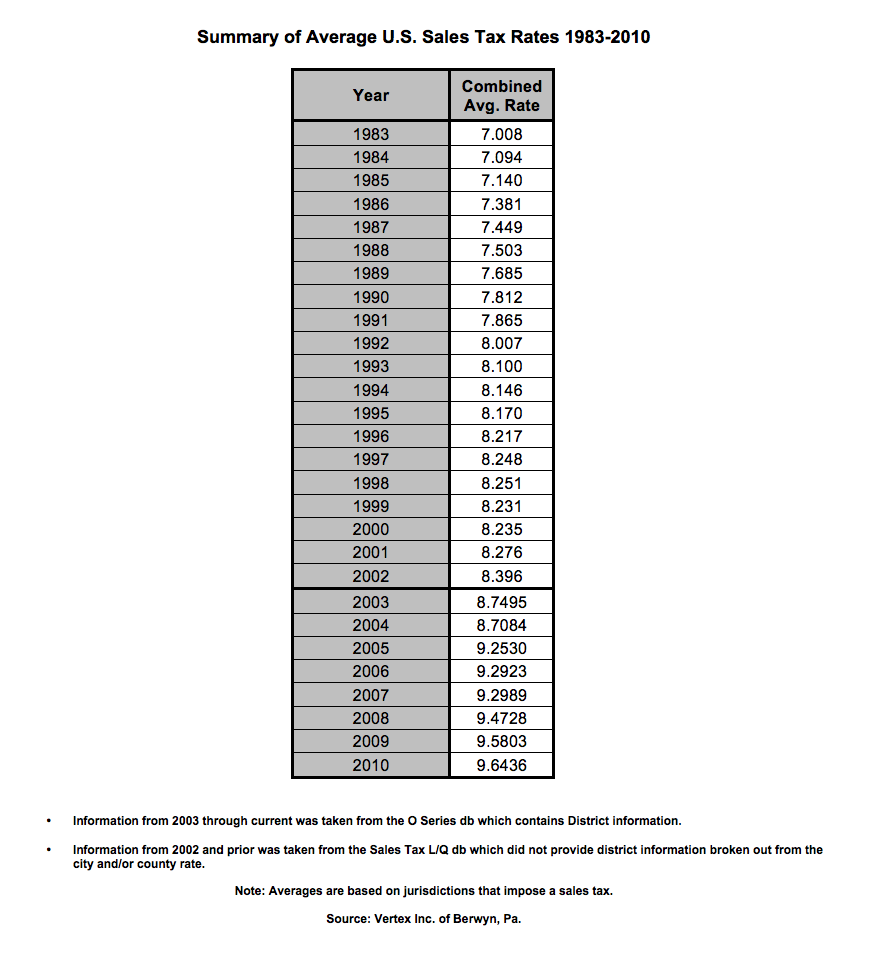
The figures are a little higher than you might expect. I’m not sure of how Vertex computes these rates. They might include excise taxes on things like gasoline, liquor, tobacco, hotels, restaurants, rental cars, airports, telecommunications, etc. etc. which are simply targeted sales taxes.
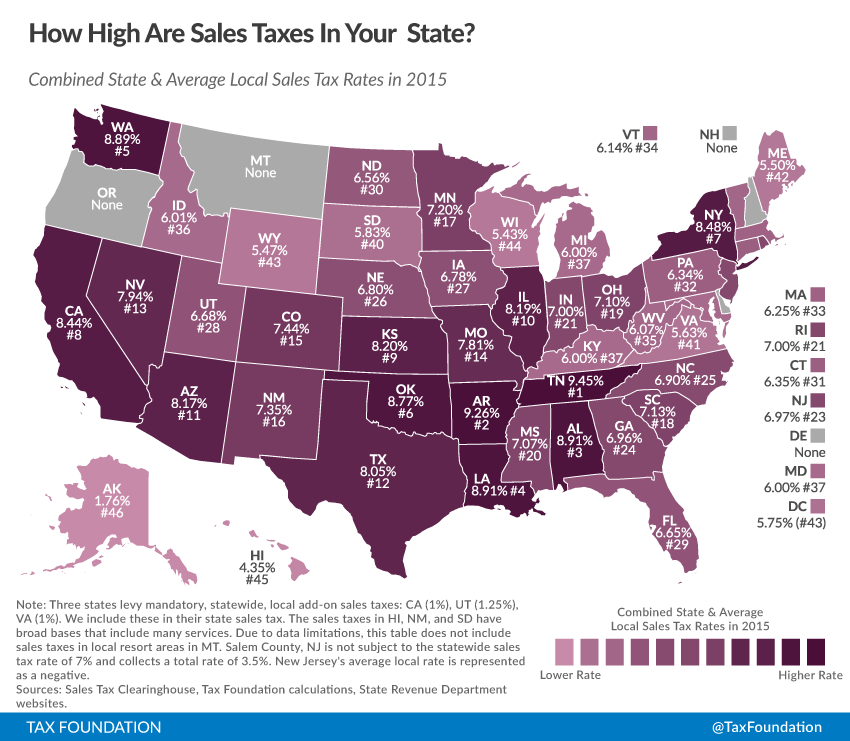
Here’s another version, from the Tax Foundation:
In any case, the main point is that the trend has been higher. Here’s a bit of recent history on sales and excise taxes, 2000-2014:
http://taxfoundation.org/article/state-sales-gasoline-cigarette-and-alcohol-tax-rates
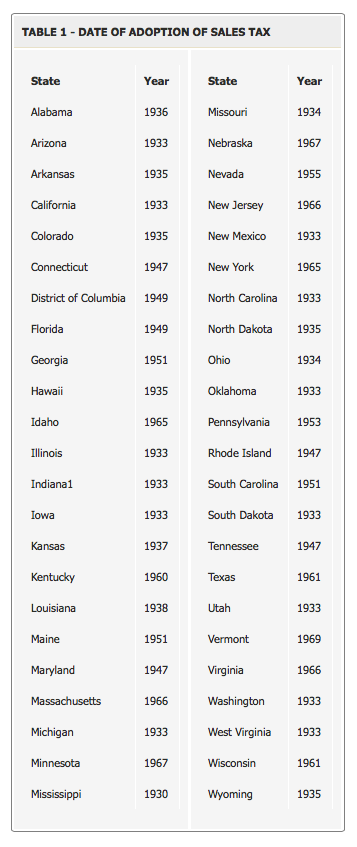
Most state sales taxes date from the 1930s:
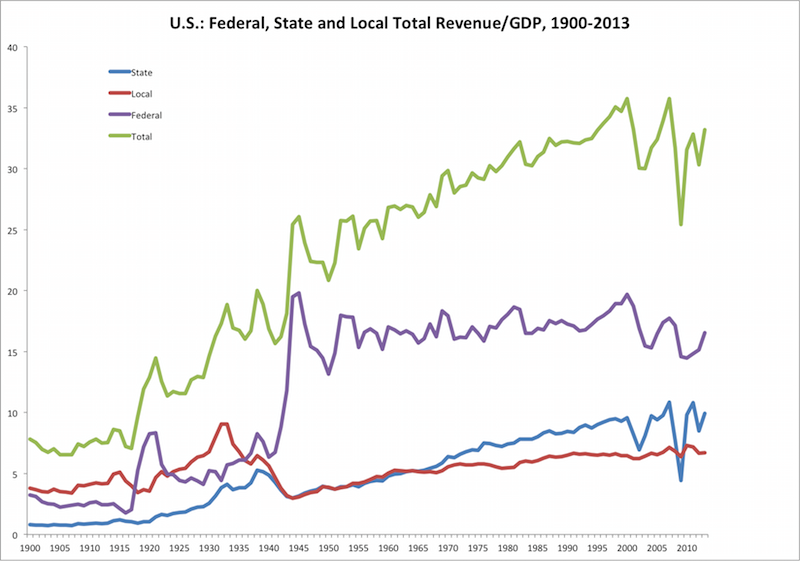
Here’s a nice look at Federal, State and Local revenue since 1900. This data comes from usgovernmentrevenue.com, which is a good source.
We see that Local taxes were the primary source of tax revenue in 1900. This is related to state-funded schooling, which spread in the late 19th century. Both State and Local taxes have a big falloff in World War II. There must have been some kind of transfer from the State and Local level to the Federal level. This data set is very jiggy around the 2009 recession, especially for State tax revenues.
One of the things you will notice here is that State and Local “total revenue” is much higher than “tax revenue”, in the preceding chart. This pushes the Federal, State and Local total well over 30%. Quite a lot of State and Loca revenue is not tax revenue.
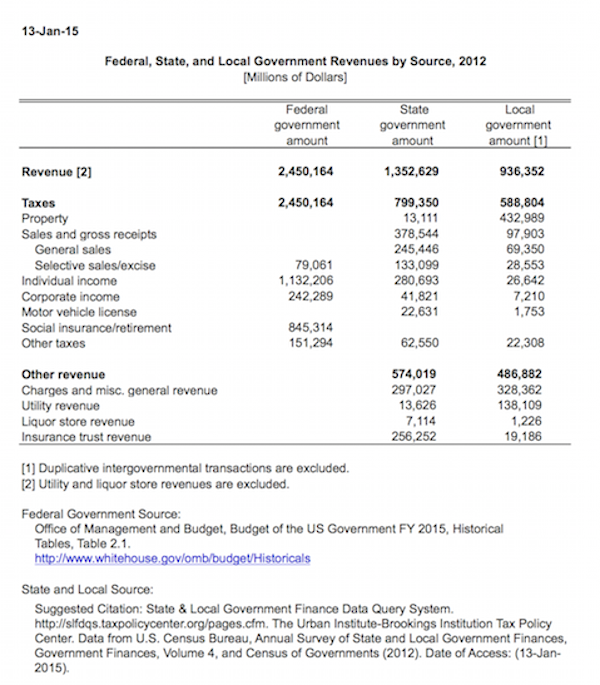
“Other revenue” accounts for 42% of State and 52% of Local revenue. Some of this is things like traffic tickets, which have evolved into little more than an extortion racket. Utility revenue is things like water and sewage, which is probably pretty benign. “Insurance trust revenue” is primarily contributions to pension programs from government employees.
Here is some info on tax revenues:
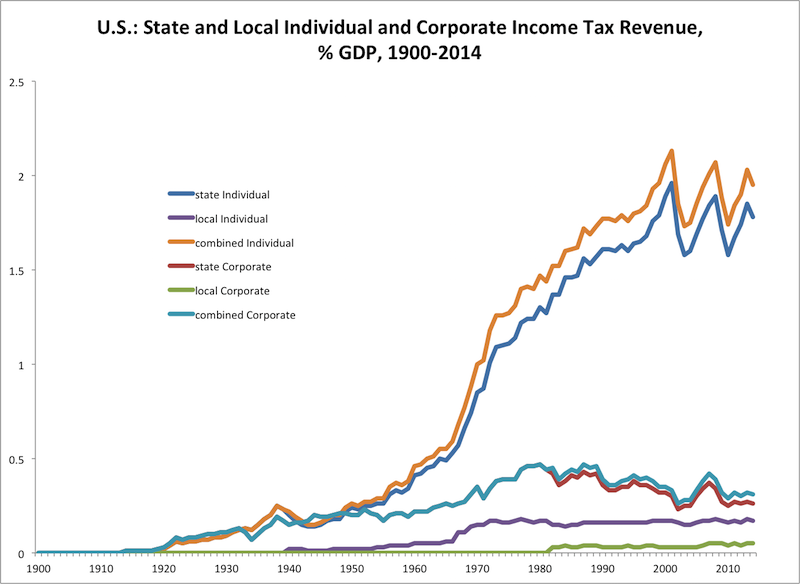
Plainly a lot of rise here, while revenues at the Federal level have been flat.
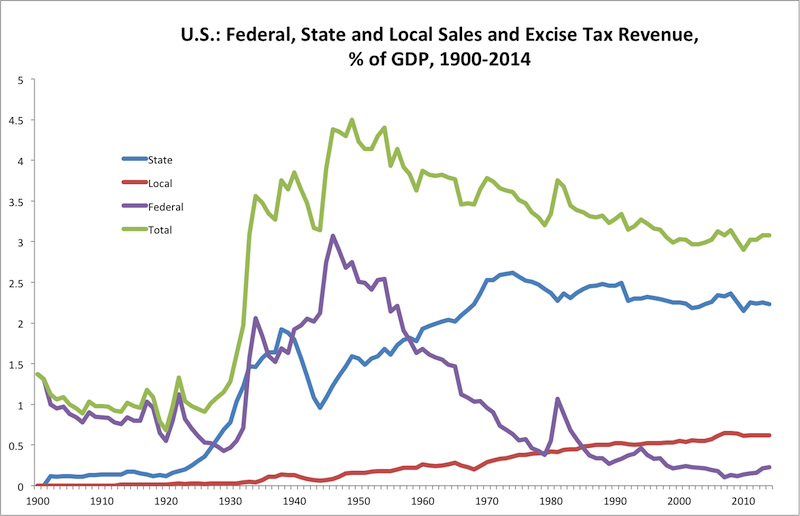
Some big increases in State sales and excise taxes, actually beginning in the 1920s in this chart despite that “sales taxes” were not formally adopted until after 1933. Higher rates (see Vertex data above) since 1980 have not led to any increase in revenue/GDP.
Finally, here’s some info on local property taxes:
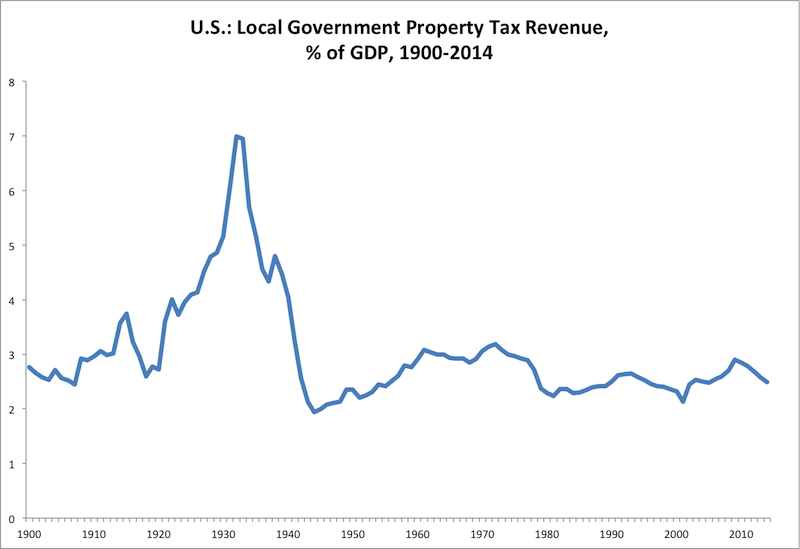
A strange burst here in the 1920s, in this data series. Pretty flat (in terms of revenue) since 1950. Of course, this doesn’t mean that tax rates have been flat.
