
The Debt Supercycle: First Look
February 19, 2012
This is a brief note. I thought I’d take a first look at the “debt supercycle” idea, which has been getting a lot of discussion recently. In particular, I thought I’d respond to this interview of Lacy Hunt, of Hoisington Investment Management, by Kate Welling, and published recently by John Mauldin.
read the whole interview here
The most interesting chart of the piece is this one:
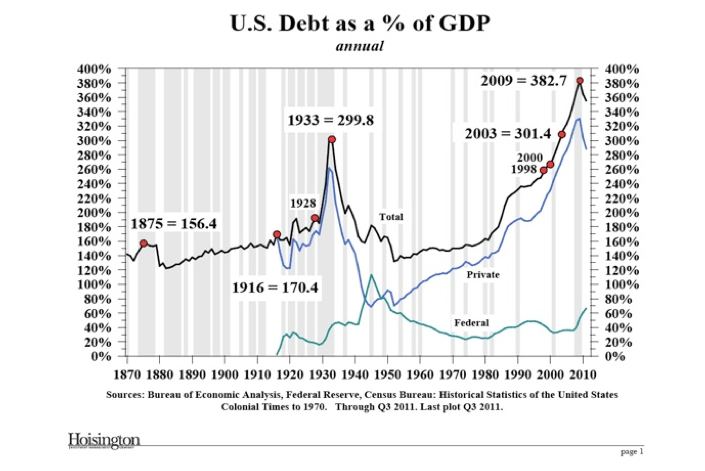
What do we see here?
Obviously, there are two big peaks, one summiting in 1933, and the other in 2009. The peak in 1933 was caused by a decrease in nominal GDP, not an increase in debt. You can see that the level in 1928 is considerably lower, and even that it seems to go down a bit in 1929. Thus, there is really only one peak that represents a rise in debt, without a large drop in nominal GDP, which is of course the 2009 peak.
Some other notes: This graph breaks out private and Federal debt. There doesn’t seem to be a slot for state and municipal debt, although that is not too big in any case. The Federal debt really gets going beginning around 1916, with World War I. During the 1950s and 1960s, Federal debt went down vs. GDP (actually it went up a bit, but nominal GDP was growing a lot faster). During the 1950s and 1960s, there was a pretty big expansion in private-sector debt, although from fairly low levels following World War II. So, the private-sector rampathon really dates from about 1950 or so. However, it wasn’t until about 1986 or so that the private sector debt matches and exceeds levels that were common before World War II.
Just take a look at that debt-a-thon, both in duration (sixty years, from 1949 to 2009) and extent (from about 65% for the private sector, to a peak around 330%).
What do we see before World War II? Squint as hard as you can, but I say that you’ll never find a big buildup of debt, in relation to GDP, during the 1920s. Of course there was a little rise, as would be expected during the “roaring ’20s,” and coming out of World War I and a stiff recession in 1920. What about earlier than that? There’s a teeny bump in 1875, although Lacy Hunt says that peak too was caused by a decline in nominal GDP, not a big rise in debt per se. Anyway, both debt and GDP figures for that time period are vague at best.
What I see here is that the present debt situation is unique in U.S. history. From this we can come to a few other conclusions: that expanding debt/GDP is certainly not necessary for economic expansion. From 1870-1929, private sector debt levels are about flat, with a modest rise that can probably be attributed to the increasing sophistication of the financial system in those years.
The funny thing I found in the interview, is that Lacy Hunt comes to completely different conclusions:
Well, all I see is the one at the present. I don’t see any evidence, on this chart, for some debt extravaganza in the 1920s or the 1870s.
Now, what I think did happen in the 1870s and 1920s/1930s is this: the economy sucked, and people with debt went bankrupt. That didn’t mean that they shouldn’t have borrowed the money. It just means that recessions are unpleasant, and hard to see beforehand. In the 1870s, there was a deflation going on, related to the return of the dollar to its prewar gold parity, which was completed in 1879. Probably there were some people — farmers, especially — who didn’t read the situation well and got caught by falling commodity prices, and other phenomena related to monetary deflation. In the 1920s, business was booming, and people expected things to continue in that fashion. When it did not, they defaulted on their debt. Nothing unusual about that, but completely different from huge surge in debt/GDP of recent decades.
A: Well, they all came after major buildups of debt. The panic years were 1873, 1929 and 2008, but if you go back and look at my first chart, in the first instance, we had
this massive buildup of debt that was complete by 1873. The panic year was 1875. The debt-to-GDP ratio peaked in 1875 because the denominator, GDP, collapsed.
Then in the second instance, the debt buildup was complete by ’29. The debt-to- GDP ratio peaked after the fact in 1933, because GDP declined. And the same was
true in 2009. The debt-to-GDP ratio peaks a year or so after the panic, because you’ve got the denominator in this ratio. But what’s interesting is that after the 1875
peak, you don’t go above it until 1916. You don’t go above the 1933 peak until 2003. So once you get these periods of extreme over-indebtedness, it takes a very
long time to resolve them.
This is pretty sloppy. Admittedly we don’t have much data here for the 1870s and earlier, but do you see a “massive buildup of debt that was complete by 1873.” I sure don’t. I have to get out a magnifying glass to see anything at all, and when I do, it just confirms that there wasn’t a massive buildup of debt, anyway certainly nothing like today. Likewise for the 1920s.
So, what’s the way out of this Debt Supercycle? One option is: you can pay the debt down. This is not really such a big deal as it sounds. It just means you don’t cash-out refi your house, and you pay off your credit cards. For corporations, it means that you use operating cashflow to reduce indebtedness, as Japanese corporations have been doing for years. For the government, it means that you don’t run a deficit, or at least, make it a small deficit. This is what was going on during the 1950s and 1960s.
Along with this, some economic growth would help. This means tax reforms, and preferably some sort of Stable Money policy. You might want to reduce the artificial advantage of debt over equity in the capital structure, basically by reducing the corporate tax rate to 20% or so and eliminating taxation of dividends. I don’t see any particular reason why we couldn’t have a fine economy with a decreasing debt/GDP ratio, as we enjoy the effects of tax reform and monetary reform, while also de-emphasizing debt (and re-emphasizing equity) in our financing choices.
Or, it could be inflated away. We are clearly on that course now. This would be a lot more unpleasant than people think. A “Lost Decade” would be the best possible outcome.
