
We continue with The Gold Standard: Retrospect and Prospect. Chapter 5 is a paper entitled “How Good Was the Gold Standard?” by Thomas Hogan.
January 23, 2022: The Gold Standard: Retrospect and Prospect
January 30, 2022: The Gold Standard, Retrospect and Prospect #2: The Price-Specie Flow Mechanism
This is certainly a worthy topic. We have hundreds of years of experience using gold standard systems, so we should be able to get a pretty good idea of how well they worked. Apparently it worked pretty well, because people used these systems for hundreds of years, which is not what happens when something doesn’t work. When something doesn’t work, there are problems, and finally, new solutions. Somebody who uses some new and better system gets better results, and rises above their peers. But, that didn’t happen. The most successful countries were always those with the best gold standard discipline, including Britain, Germany, France and the United States (excepting the Civil War years). The least successful were those with floating or unreliable currencies, including Spain, Greece, and Portugal. Also, the people who used these systems all their lives were generally very happy with the results.
Here, at the outset, let’s put down some ideas of what I would consider, if I was writing a paper like this.
How good was the gold standard at what? What is the ideal? The answer, of course, is that we want gold to be Stable In Value. If the value of gold (as the standard of value) went up a lot, or it went down a lot, there would be problems. This is no different than the many countries today who use some type of “euro standard.” If the floating euro went up a lot, or went down a lot, there would be some kind of problem, generally known as “inflation” or “deflation.”
Here again is Michel Chevalier, from 1853:
When mankind, by common consent, and with an unanimity which is deserving of notice, selected these two metals to serve as coin or measures of value, and equivalents for every other exchangeable article, … the circumstance of the value of these two commodities being … little subject to fluctuation, doubtless exercised a decisive weight in the choice. The functions of coin require that the material of which it is made should nearly approach—it can never attain—the condition of fixity of value; for were the material so selected subject to great and sudden fluctuation in value, it is evident, that in employing it as the standard by which all the productions of human industry are to be appraised and exchanged, we should introduce into business transactions an element of uncertainty which would hamper and derange them.
This is true of the gold standard, and it is true of any “fixed value” system, which keeps the value of the currency linked to some benchmark, such as the USD, EUR, a currency basket, a commodity basket, or any other thing. More than half of all countries today have an official policy of fixing their currencies to some external standard, typically the USD or EUR.
Here’s John Maynard Keynes:
[Markets] cannot work properly if the money, which they assume as a stable measuring-rod, is undependable. Unemployment, the precarious life of the worker, the disappointment of expectation, the sudden loss of savings, the excessive windfalls to individuals, the speculator, the profiteer–all proceed, in large measure, from the instability of the standard of value.
George Gilder wrote a whole book about this principle, very nicely exploring its details and implications, The Scandal of Money (2016):
Casting a shroud of uncertainty over all valuation, monetary manipulations shorten the time horizons of the economy. In information theory, the dominant science of our age, when a medium sends a message of its own–static on the line–it’s called noise. Noise in the channel reduces the channel’s capacity to transmit accurate information.
And here is James Madison, our fourth president:
The only adequate guarantee for the uniform and stable value of a paper currency is its convertibility into specie [gold]–the least fluctuating and the only universal currency.
And of course that wonderful quote from George Bernard Shaw:
You have to choose … between trusting to the natural stability of gold and the natural stability of the honesty and intelligence of the members of the Government. And, with due respect for these gentlemen, I advise you, as long as the Capitalist system lasts, to vote for gold
December 7, 2016: The Gold Standard Vs. The PhD Standard
I looked into this topic in Gold: The Final Standard. Basically there were three situations in the last 300 years, from 1700, where you could argue that gold underwent some significant change in value, thus compromising its role as a Stable Standard of Value. The first was the California Gold Rush of the 1850s; the second was the decline in commodity prices in the 1880s-1890s; the last was the Great Depression of the 1930s. In all three cases, I concluded that there was no significant change in gold’s value, causing some sort of economic difficulty. This was not actually a very odd conclusion, as it was also the most common conclusion of those living at the time, and continuing to today.
Now, continuing from this first principle, we can see that there might be many, many situations where there are economic difficulties, even with a currency that is perfectly stable in value, or with a gold standard system. Thus, we can’t just use economic performance as a metric. We have to ask: Were there problems caused by a significant rise or decline in currency value? For example, since 2010, Greece has had a number of economic difficulties, while Germany has mostly got along fine. Both use the euro. From this, we can conclude that, whatever Greece’s problems may be (compared to Germany), they were not caused by the euro. (Both Greece and Germany may be suffering certain issues in fact related to the euro and ECB, including the recent negative-interest-rate policy, but Greece’s other problems have overshadowed those for now.)
Similarly, there were a lot of problems in the US, related to the “free coinage of silver” arguments (basically, a 50% dollar devaluation), along with some other issues. There were no such problems in Germany, which was also using a gold standard at the time. Here’s US Industrial Production:
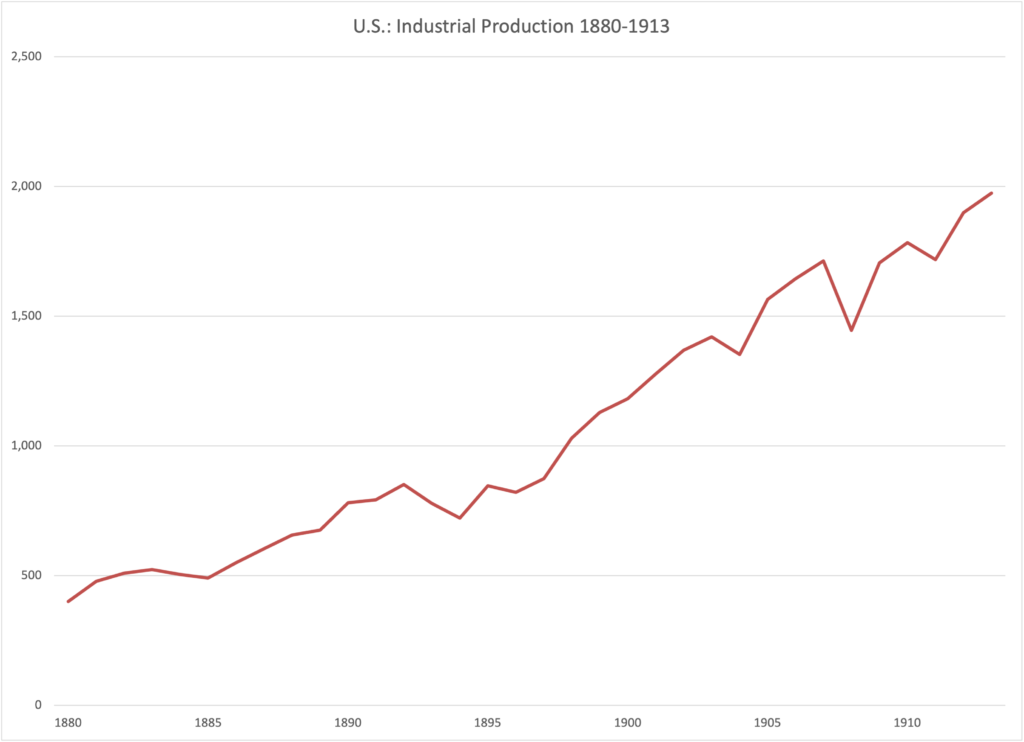
You can see some substantial difficulties in the 1890s. US Industrial Production in 1896 (the end of the crisis) was about the same as in 1890, which was very bad performance for those days.
Here was industrial production in Germany:
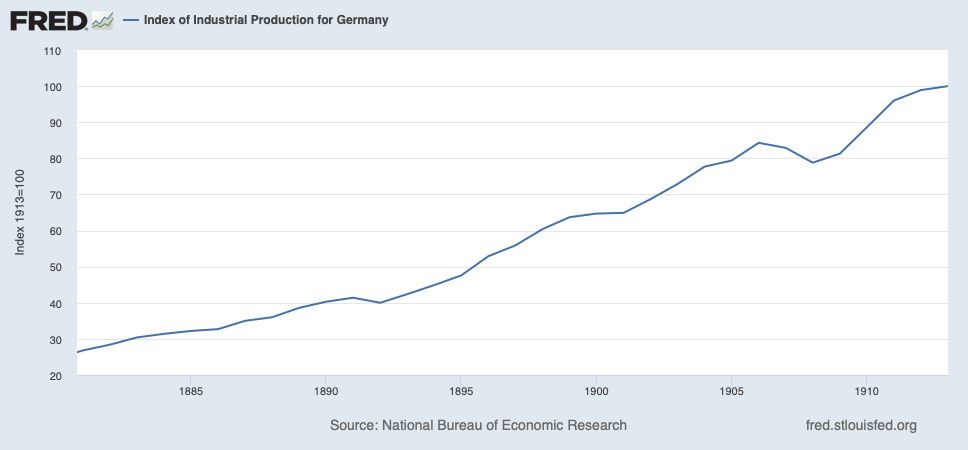
There was a little dip in 1892, since these issues tended to have international implications, but basically Germany was fine in the 1890s. Industrial Production in Germany in 1896 was 31% higher than in 1890, which is not too shabby for just six years. Wow.
Also related to this, we can see that if there is a problem in one country using a gold standard system, but not in other countries also using gold as a standard of value, then we can’t really blame gold. These might actually be monetary and financial system problems, as opposed to problems arising from other causes, but they are not caused by gold’s failure to act in its role as a Stable Standard of Value. For example, there were difficulties in the US leading to the Panic of 1907, which in turn led to the creation of the Federal Reserve system. These were genuine institutional or regulatory issues, related to the particulars of the gold standard monetary systems and banking regulatory frameworks then in use. However, other countries using the gold standard, including Canada, Britain or Germany, did not have any such problems. Obviously, this was not due to gold, but to some US-centric issue. George Selgin had some pretty good comments on this in Money Free and Unfree (2017):
June 23, 2018: Economic Ups And Downs, 1870-1914
A fourth issue, that we always must remember, is that today’s economic statistics basically didn’t exist before 1950. The United States was one of the earliest governments to begin to accumulate detailed economic statistics, from a large staff of researchers at government agencies. The modern Consumer Price Index dates from a major revision in 1940. Before then, the data was based on a far smaller basket of goods from a far smaller number of cities. The Bureau of Labor Statistics started collecting these statistics in 1919. Before 1919, the BLS had a very limited budget and produced very dubious statistics. Royal Meeker, who was in charge of the project at BLS from 1913, said:
I had become very suspicious of the Bureau’s index numbers, especially its retail price index. Some people here present will no doubt recall that I was wont to have fun with the Bureau’s index numbers, I no longer have fun with them—they have fun with me.
So I would not treat these indexes as Holy Writ. The people who made the indexes thought they were pretty dubious.
The GDP statistics date from the mid-1940s.
In response to this need in the 1930’s, the Department of Commerce commissioned Nobel laureate Simon Kuznets of the National Bureau of Economic Research to develop a set of national economic accounts./1/ Professor Kuznets headed a small group within the Bureau of Foreign and Domestic Commerce’s Division of Economic Research. Professor Kuznets coordinated the work of researchers at the National Bureau of Economic Research in New York and his staff at Commerce. The original set of accounts was presented in a report to Congress in 1937 and in a research report, National Income, 1929–35.
Early in 1942, annual estimates of gross national product were introduced to complement the estimates of national income and to facilitate war time planning. Wartime planning needs also helped to stimulate the development of input-output accounts. Nobel laureate Wassily Leontief developed the U.S. input-output accounts that subsequently became an integral part of the NIPA’s. In commenting on the usefulness of the national accounts, Wesley C. Mitchell, Director, National Bureau of Economic Research, said: “Only those who had a personal share in the economic mobilization for World War I could realize in how many ways and how much estimates of national income covering 20 years and classified in several ways facilitated the World War II effort.”
You can see this in the starting date of these official GDP statistics. The GDP Deflator, a popular price index, begins in 1947. This was also the start year for the rest of the National Income and Profit Accounts, which contain GDP. Anything before that was a provisional study, based on much skimpier data.
Today, there is a lot of discussion about the idea that typical records of “GDP” or “prices” from before 1940 are simply not very good. In this paper, Selgin recounts recent revisions to old statistics, showing that economic downturns were much milder than typically assumed today:
June 23, 2018: Economic Ups And Downs, 1870-1914
Christina Romer’s (1986a, 1989, 2000) influential work has, however, cast doubt even on this more attenuated claim. According to her, the Kuznets-Kendrick pre-1929 real GNP estimates overstate the volatility of the pre-Fed output relative to that of later periods, in part because they are based on fewer component series than later estimates and because they conflate nominal and real values, but mainly because the real component series are almost exclusively for commodities, the output of which is generally much more volatile than that of other kinds of output. From 1947 to 1985, for example, commodity output as a whole was about two and a third times more volatile than real GNP. (p.223.)
And indeed, we hear all about the various slumps and “panics” of the pre-1913 era, but somehow, the US had tremendous economic growth, at a rate that was never exceeded in the whole 20th or 21st centuries.
Today, we have two issues regarding economic statistics from before 1950 or so: First, the limitations of creating statistics based on data from decades earlier, normally with a very limited data set; and second, the fact that economic structure really was different in those days, and thus comparing to statistics today might not be very appropriate.
For example, in many emerging market countries today, like Egypt, Indonesia or Bangladesh, food prices are a large component of typical consumer spending. Thus, any index weighted toward typical consumer expenditures would have a large component of food prices. Even with perfect statistical accuracy — leaving aside the problems of collecting statistics from perhaps fifty or a hundred years earlier — an index of this sort would have a very different behavior than an index for a developed country. The CPI would be much more variable, reflecting changes in food prices.
It’s worth noting that commodity prices are typically the easiest prices to get a hold of. Collecting price data for something like education or restaurants or medical care, for the 1880s in the US, is much more difficult. Also, commodity prices tend to be pretty similar nationwide, while prices for education or restaurants can vary hugely from one city to another, or one neighborhood to another in the same city. Today, daycare costs $120/day in some places, and $35/day in other places. You can hardly get out of a Manhattan steak restaurant for less than $100 a person, but the Sizzler in Detroit has a $26 special. Thus, we accumulate these statistics by taking an average of many individual locations. Just try doing that for 1880. This is another reason that tends to skew statistical efforts toward commodity prices.
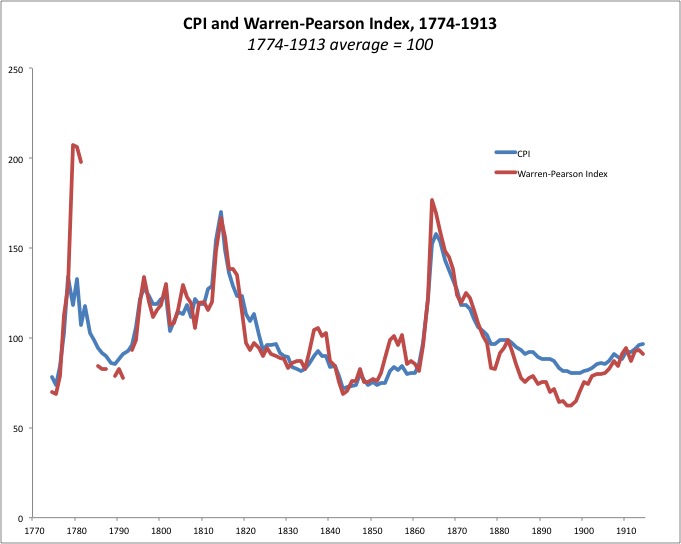
Anyway, the result is that the “CPI” for the pre-1913 period is very highly correlated to commodity prices, while it is hardly correlated at all in the post-1950 era. Here we compare a “CPI” to the Warren-Pearson Index, a straight commodity index.
March 3, 2016: The Myth of “Price Instability” During the Gold Standard Era
Here is the CRB Commodity Index and the CPI since 1970:
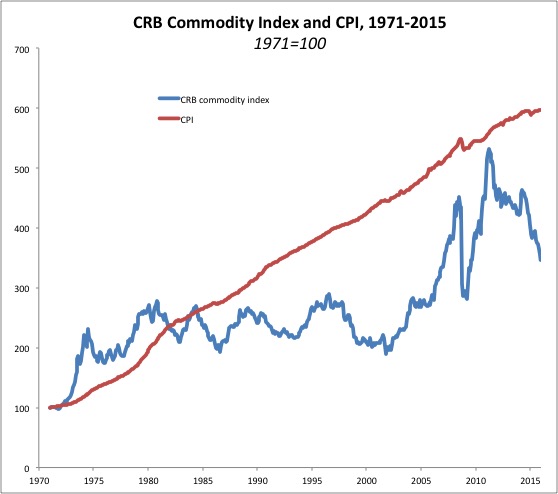
See the difference in correlation?
Now, if you were taking an apples-to-apples comparison, with one commodities index (Warren Pearson) and another (CRB), we find that: The standard deviation of commodity prices for the WPI in 1880-1913 was 6.74%, and for the CRB in 1970-2015 was 14.67%. However, the standard deviation for the CPI for 1970-2015 was 3.02%. So, if you compare today’s CPI to the “CPI” of 1880-1913, it looks a lot better. But, if you compare one commodities index to another, the floating fiat currency era looks a lot worse, which is what you would expect when you go from Stable Money to a floating fiat currency.
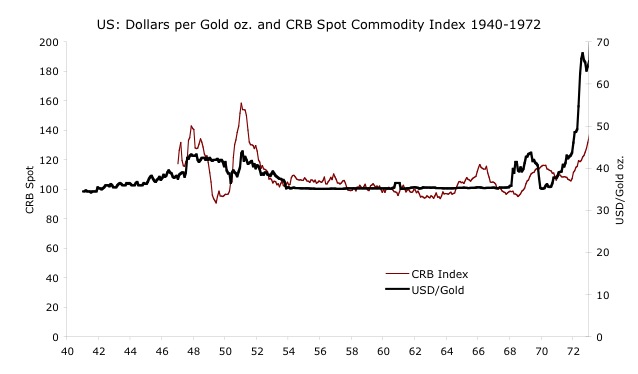
This is what commodity prices looked like during the most recent era of the gold standard system, the 1950s and 1960s:
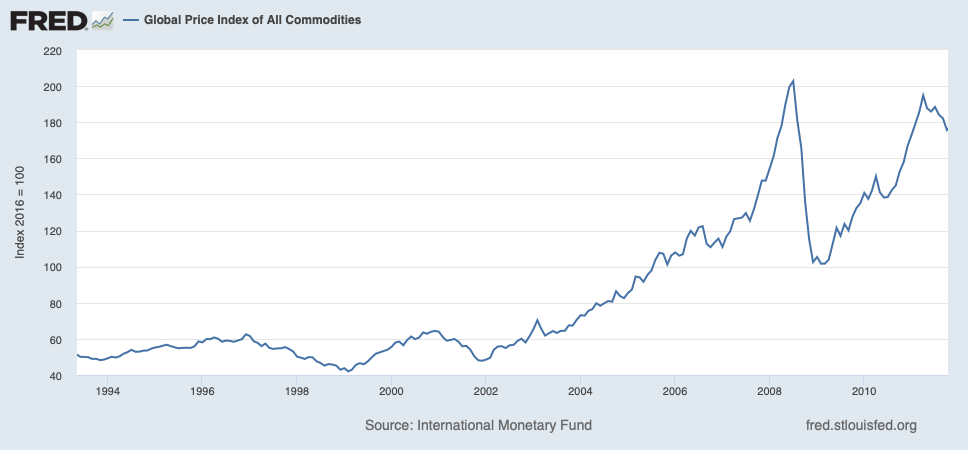
Related to this, we have economists today getting all flustered because some commodities index went up or down 20% in the pre-1913 period. Do these economists have any idea what has been going on recently? Here is what commodity prices looked like over the past few years:
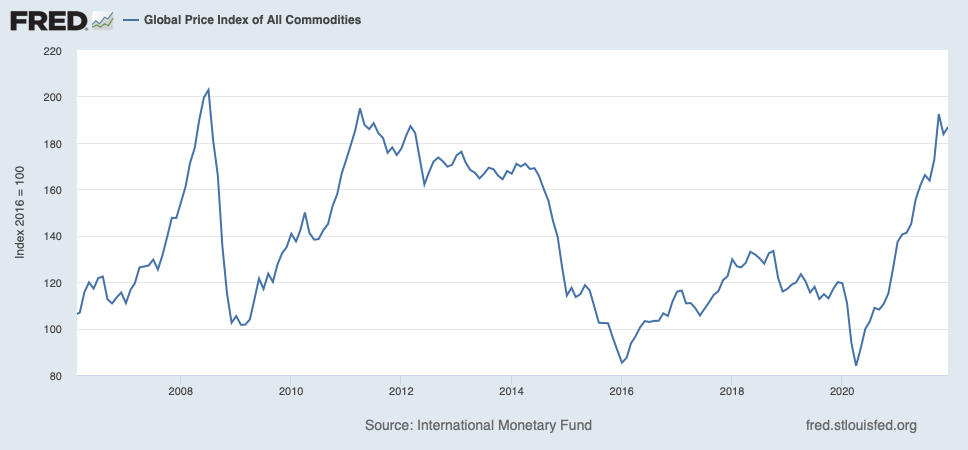
These are huge 50% moves, and in only a few years, not a 20% move stretched over a decade. And yet, we don’t hear a whiff of comment about that. These people have very little grasp of the real world.
Also, I have, over time, discarded the idea that a gold standard system, or any monetary system, should produce “stable prices.” Of course we want to avoid changes in monetary value, that lead to changes in “prices” (basically, a broad index like the CPI). But, even with an ideal currency of stable value, we might see big changes in prices. One example of a big decline in prices was, of course, the early years of the Great Depression, before the devaluation in 1933. Although there were many problems in those days, I do not find that there was any problem with gold serving as a measure of Stable Value. Prices simply fell due to economic difficulties. This is basic Keynesian “aggregate supply/aggregate demand”-type stuff.
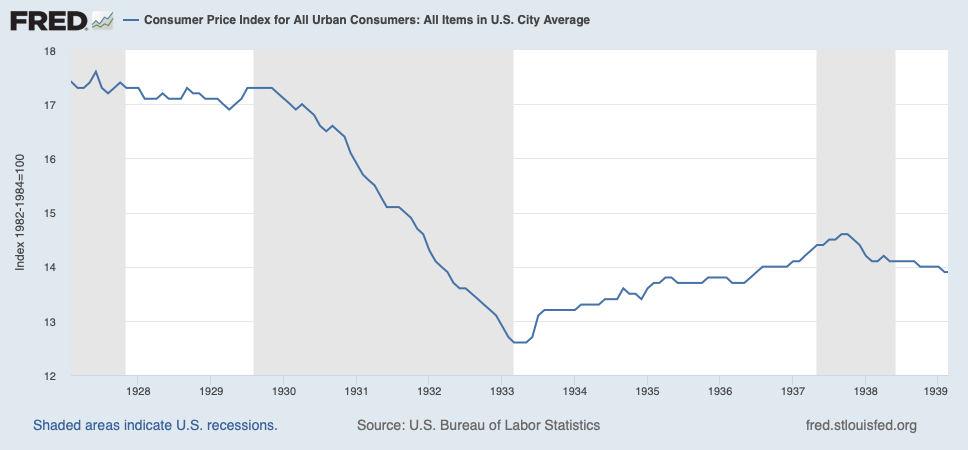
That’s a decline from 17.3 in July 1929 to 12.6 in March 1933, a fall of 27%. That’s gotta hurt.
On the other hand, very high growth has led to big rises in the CPI, which is just a healthy aftereffect of growth. When countries get rich, prices go up. The cost of a restaurant or doctor in Tokyo is a lot more than in Manila. If the Philippines got as rich as Japan, prices would rise to Japanese levels.
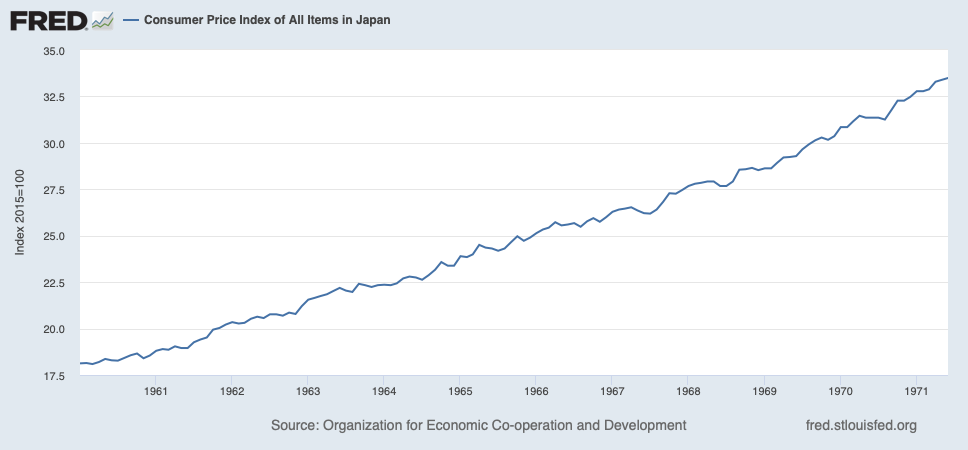
The CPI in Japan was 18.13 in January 1960, and 30.85 in January 1970, a rise of 70%. This averages 5.4% per year. This happened while the yen was pegged to gold at 12,600/oz. via the Bretton Woods system. (Japanese wages rose about 300% during this decade, so they did OK.) However, yen-denominated commodity prices were dead flat, as shown in the chart above.
Japan doesn’t even have official CPI statistics from before 1960, or GDP from before 1955. These are postwar phenomena. Remember that, when you hear about “changes in the CPI [or “price level”] in 1885.”
Thus, whether we see a big decline in “prices,” as in the early 1930s, or a big rise as in the 1960s in Japan, this is not a problem for the gold standard, serving its role as a Stable Standard of Value.
April 10, 2011: Gold Is Stable In Value
April 17, 2011: Gold Is Stable In Value #2: Interest Rates
May 29, 2011: Gold Is Stable In Value #3: Production and Supply
June 5, 2011: Gold Is Stable In Value #4: More Commodities Prices, and Commodity Baskets
China also had a yuan linked to gold during the 1950s and 1960s, just like Japan. But, while Japanese were getting rich, Chinese were getting dead. During the Great Famine (1959-1961), somewhere between 15 and 55 million Chinese are thought to have perished. The population of Anhui Province fell 18%. Was this the gold standard’s fault? You can see the problem of attributing overall economic performance only to a monetary system.
More recently, the dollar has fallen by quite a large amount vs. gold, indicative of a substantial decline in dollar value — or, basically, “inflation.”
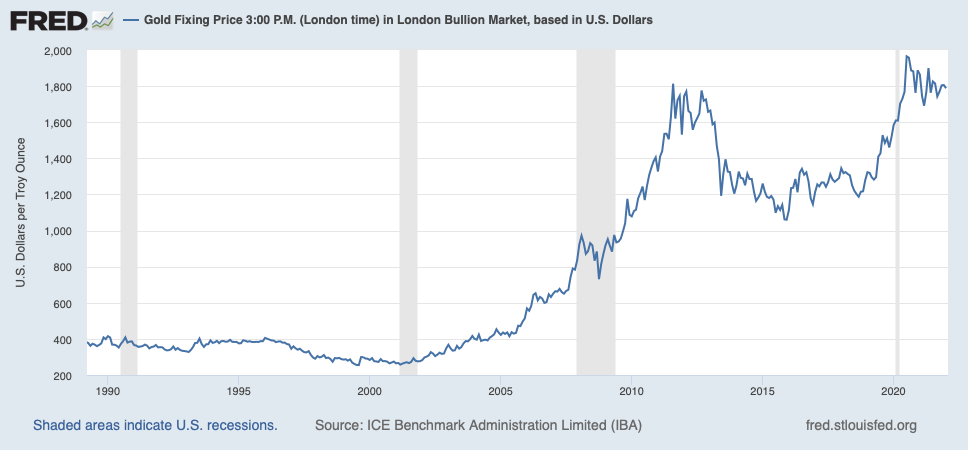
Leaving aside the recent decline in the dollar vs. gold since 2019, we see a move from a plateau around $350/oz. in the 1990s to around $1250/oz. during a few years in 2013-2019, what I call the “Yellen Gold Standard.” If we take gold as a stable measure of value, this implies that the dollar’s value fell by 72%; or, it was worth about a quarter of what it was worth during the 1990s. But, even if we say that maybe gold is not a perfect measure of value, and the dollar didn’t decline perhaps by a perfect 72%, there was certainly a lot of other evidence that the dollar was losing value by some substantial amount.
However, popular price measures such as the CPI and the similar Personal Consumption Expenditures (favored by the Federal Reserve) didn’t show much rise. In the common ex-food-and-energy form, they hardly budged.
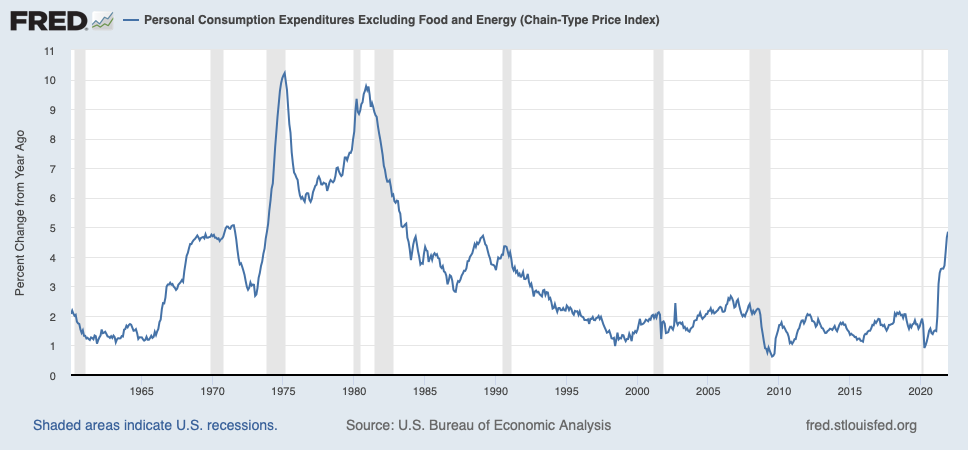
We can see that the Core PCE (ex-food-and-energy) was drifting below the Fed’s supposed 2.0% “inflation target” between 1995 and 2020. There are a number of reasons for this, including a lot of revisions to the CPI/PCE, all of which tended to make the figures lower than they would have otherwise been. Also, I think there were real economic structural issues, having to do with a flood of new labor supply and cheap imported goods from places like China, since 1995, which tended to depress pricing power.
But, what we see is: A CPI of 5%+ in Japan, with a stable gold standard currency (“no inflation”); and a Core PCE below 2% in the US, while the dollar seems to have lost a substantial amount of value (“inflation”). Nevertheless, the outcomes were exactly as one would expect. Japan had gigantic prosperity, with a gold standard system, and the US in 2000-2020 had rather poor economic performance, during a time of substantial currency decline, with a widespread sense that things were deteriorating, especially for the lower 80% of the income distribution. Stable Money works, but it doesn’t necessarily work because it leads to “more stable prices” according to some heavily-managed government price index.
To take another example, we remember the 1960s as a time of prosperity. It was the most prosperous decade, in the US and around the world, since 1913. (The 1920s in the US were also pretty good, and arguably better, but worldwide prosperity was not as good.) The 1970s were a “stagflationary” disaster in which everything seemed to go rotten. Then, the 1980s were a time of prosperous recovery from the 1970s malaise. In other words: Up, Down, Up.
And yet, if you believe the official economic statistics, the 1970s were no worse than the 1960s and 1980s, although with perhaps a bit more volatility.
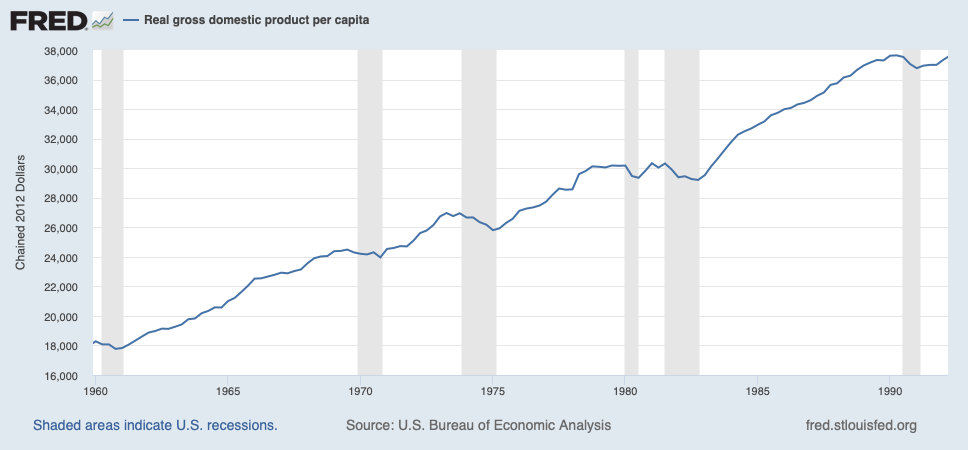
According to this, per capita real GDP rose 35% during the decade of the 1960s; 24% during the 1970s, and 24% during the 1980s. It’s as if nothing happened at all.
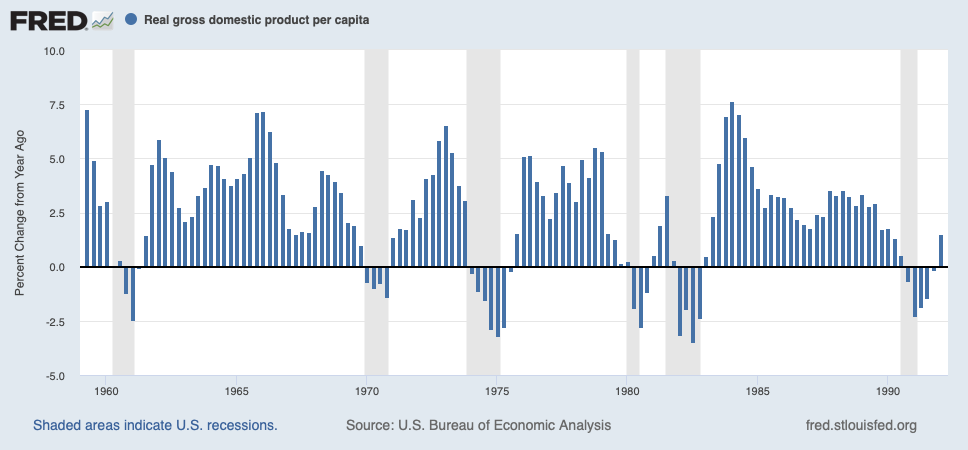
We are supposed to believe that during the Carter “malaise” years, the US economy was booming with 3%-5% “real” per-capita growth — better growth than nearly the entire 1980s, except for the 1984 recovery. There was some nasty business in 1973-74 and again in 1979-1980, which we can conveniently blame on naughty Arabs. Definitely Not Our Fault. Except for those darn Arabs, the 1970s would have been as wonderful as the 1960s! We promise!
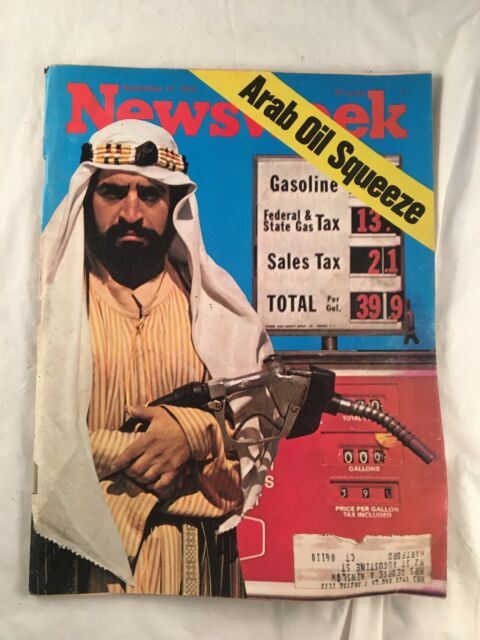
Not our Fault! It was an “external shock”! (Newsweek magazine September 1973)

Not Our Fault! Shocks! Shocks! (Newsweek magazine July 1979)
Basically, what is happening here is that the “inflation” adjustment between nominal and “real” (the GDP deflator) was substantially understated. I can’t imagine why politicians might want to make things look better than they actually were; or, that the Chief Executive would have no influence over the statistical agencies that he controls. Also, it might be a fluke of how the statistics themselves were collected, even with good intentions. The point is, a lot of this “growth and inflation” data smells very fishy. Economists that simply use these statistics without question can’t be taken seriously.
Here is perhaps my one single favorite statistic about “how well the gold standard worked.”
Well, that was certainly a long preamble, so let’s get on with the paper:
I don’t want to comment too much on specifics, since then we would never be done. In general, the approach of the author is to look at “price stability,” “economic performance,” and maybe other issues such as “financial stability.” This seems reasonable, but, as I have just indicated, these are not the right questions to ask. The right question is: Did gold serve its intended role as a stable standard of value? And, if it did, was this beneficial? The second question can be answered largely on a theoretical basis: Theoretically, a currency of stable value is a highly desirable thing, because of the known problems that emerge when currency values vary by significant amounts. Plus, we have centuries of history, going back to Ancient Greece, where societies with reliable currencies tend to do well.
Instead, this interest in “price stability” and “economic performance” is actually a construct of the Soft Money, floating currency crowd. It is, quite literally, the Fed’s “dual mandate,” which has been a justification of floating currency manipulation. Issues of “financial stability” are largely institutional/regulatory issues with the banking industry, that don’t have much to do with gold as a stable standard of value. For example, the Bank of England adopted a series of principles known as the “lender of last resort” in the second half of the nineteenth century, to address certain issues related to the banking industry. This was not in any conflict with the Bank’s gold standard policy. Some (including George Selgin) have argued that the same advantages could also be accomplished with a decentralized free-banking system, also linked to gold, as Canada had in 1907.
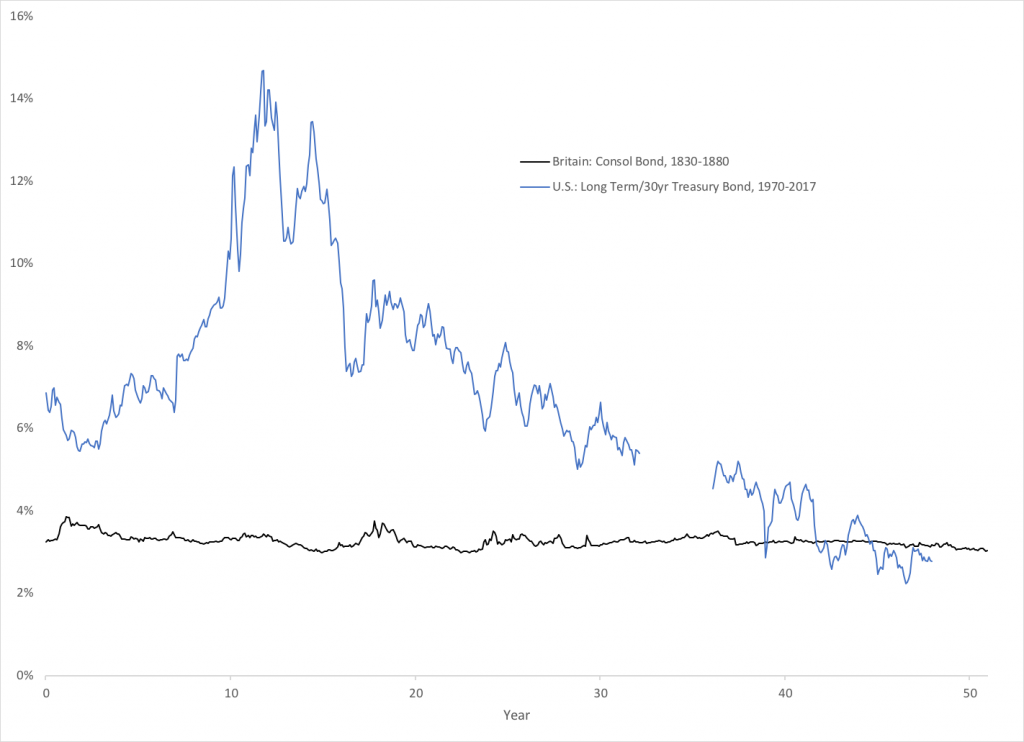
Nevertheless, although I have stated that “price stability” is not necessarily a goal of a gold standard or any hypothetical Stable Value system, nevertheless, the long-term deterioration in currency value that tends to happen in discretionary floating fiat systems does lead to big changes in overall price levels. The USD today is worth about 1/90th of its value in 1930, compared to gold.
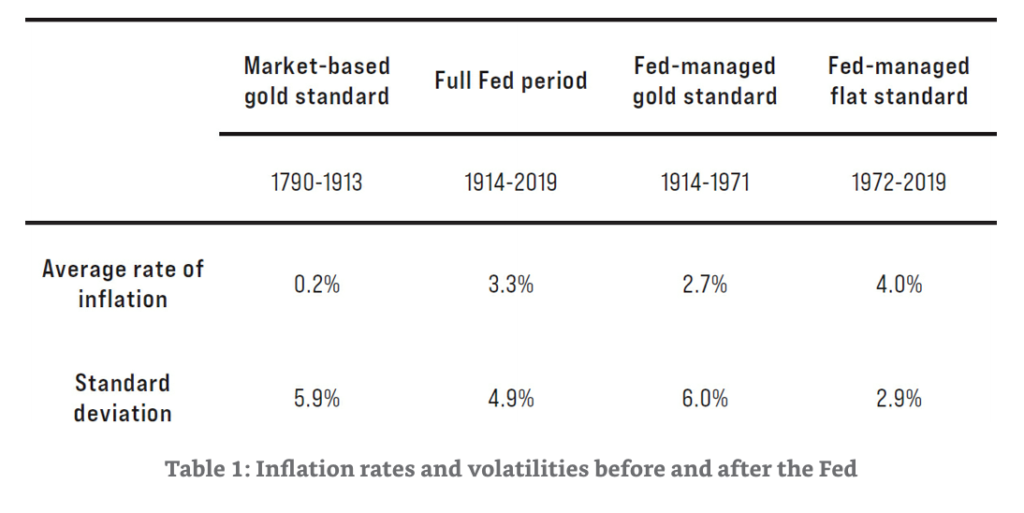
Here, the author compares supposed economic statistics for three periods. The average rate of inflation is higher for the “Fed Managed Fiat Standard,” but the standard deviation is lower. I have already noted that this is mostly a statistical flaw: old statistics mostly represent commodity prices. But, the general idea is that there has been a strong inflationary trend since 1971. The USD is worth about 1/50th of its value in 1970, compared to gold. If this continues at a similar pace for the next fifty years, we would be at 1/2500th of the 1970 value. It’s worth noting that the author includes, in his “gold standard” periods, long stretches of floating fiat currencies such as during the Civil War, and also outright devaluations, including 1933.
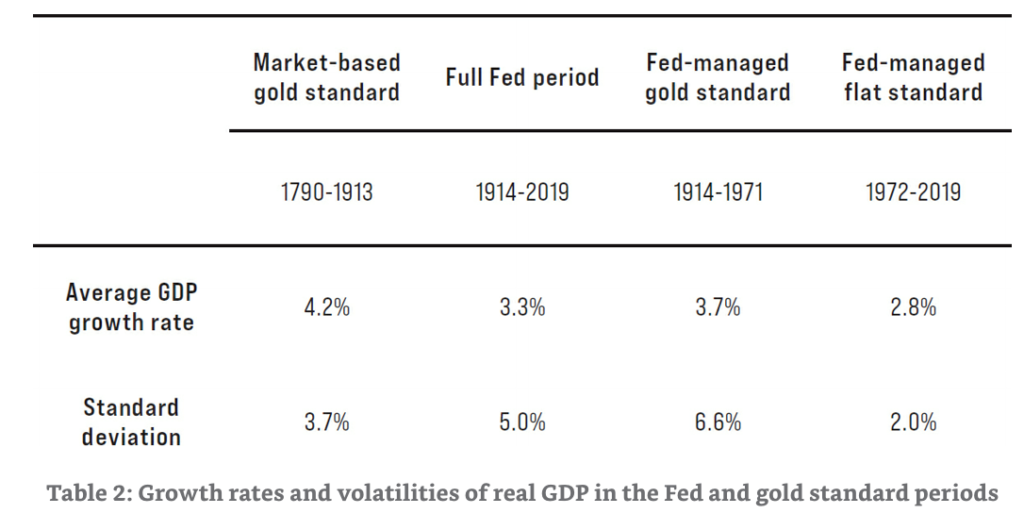
Here we have some economic statistics, supposedly showing some advantage for the gold standard periods.
In section 3.2 of the paper, the author has a long and valuable section detailing many of the problems surrounding these “price stability and growth” comparisons, which I will quote at length here.
3.2. Volatility of Real GDP Growth
Following World War II, many economists came to believe that a Fed-managed money supply had improved economic stability. In 1960, Fed Chair Arthur Burns argued that the severity of business cycles had declined and that future recessions were “likely to be appreciably milder on the average than they were before the 1940s.” Through the mid-1980s, economists such as J. Bradford DeLong and Lawrence Summers found that “the amplitude of cyclical fluctuations is much lower” in the post-war period than it had been prior to World War I. Research since that time, however, has come to much different conclusions.
In a series of papers published in 1986,Christina Romer identified inaccuracies in the historical data on U.S. industrial production and gross national product (GNP). The problem, as Romer explained, resulted because the historical data for the pre-Fed period had been estimated using an index of commodity prices. Economists had used commodity prices because they were readily available at the time and constructing a broader price index was difficult. However, commodity prices tend to be more volatile than other prices in the economy.
Since real GNP is calculated by dividing nominal GNP by the price level in each period, using the excessively-volatile commodity price index as a measure of the price level made the resulting real GNP series appear to be excessively volatile, as well. Whereas previous studies had found that economic volatility was higher prior to the creation of the Fed, Romer showed that this excess volatility was merely “a figment of the data.”
After identifying errors in the historical data, Romer provided her own updated datasets. Her revised real GNP data suggests that economic fluctuations were roughly the same prior to the Great Depression as they were in the period after World War II. In another study, she and co-author Jeffery Miron provided a more detailed monthly GNP series back to 1884. The aggregate fluctuations in this series are similar to Romer’s other measures, but the pre-Fed period has more intra-year volatility, which, the authors argue, “suggests that the economy had a rapid, though not instantaneous, self-righting mechanism.” Romer argues that Fed policy has improved stability in some ways, but she finds a rise in “policy-induced recession[s] that explains why the economy has remained volatile in the postwar era.”
Building on Romer’s research, Joseph Davis provides an annual index of industrial production back to 1790. This improved measure of production also shows that the supposed “depressions” of 1839 and 1873, two of the worst economic downturns before the Fed, “were actually rather mild recessions.” Davis goes on to show that the official dates of U.S. recessions as classified by the National Bureau of Economic Research do not correspond to his corrected dataset. His estimates show much shorter average durations of recessions on the market-based gold standard from 1796 to 1914 compared to the traditional measures. Using a more complex dynamic factor analysis, Albrecht Ritschl, Samad Sarferaz, and Martin Uebele find evidence similar to Romer’s that “the gold standard historically did at least as well as the Fed at creating economic stability.”
When properly measured, the standard deviation of real GDP growth appears to have been lower prior to the Fed. As shown in Table 2, the standard deviation of real GDP growth was 3.7 percent during the market-based gold standard period and 5.0 percent during the full Fed period. Real GDP growth was especially volatile under the Fed-managed gold standard period, which includes both the Great Depression and World War II. It has been considerably lower under the Fed-managed fiat standard, at 2.0 percent. This evidence is consistent with the view that—after an initial learning curve—Fed policy has effectively reduced the volatility of real GDP, though perhaps at the cost of lower real GDP growth. However, it is also possible that the simple standard deviations presented in Table 2 overstate improvements in stability under the Fed; or, that the reduced volatility experienced during the Great Moderation is due primarily to non-monetary factors.
This is really quite splendid, and illustrates exactly why this “price level and GDP” stuff is not very fruitful. We can tell the economy was doing pretty well the late 19th century, due to statistics like this:
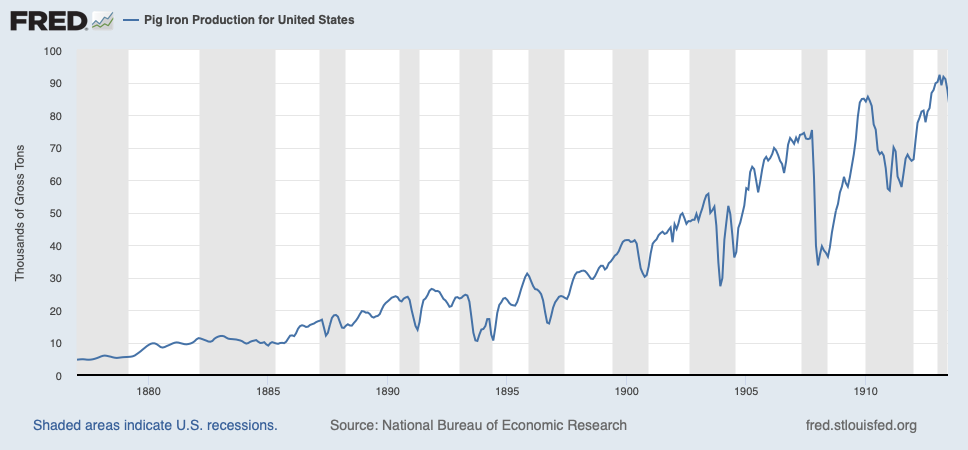
This is steel (pig iron) production, growing 20 times between 1877 and 1913.
Now, when you look at this, maybe you will conclude that despite big gains end-to-end, there was a lot of volatility along the way. Was this caused by the gold standard — that is, by some kind of change in gold’s value, compromising its role as a Stable Standard of Value? Or was it other things? Although economic policy was generally rather good at the time, there were many minor issues, including various tariffs, the aforementioned issues in the 1890-1896 period, and the Panic of 1907 which was more about institutional/regulatory issues. We had the Spanish-American War in 1898, and some problems with an unstable Mexico in 1910-1913. You had the usual cycle of enthusiasm and despair among investors and businessmen trying to predict the unpredictable future, the chaotic and roiling margin of innovation and creation. Affecting steel directly, we have issues regarding the regulation of railroads during the Progressive Era.
As president, Theodore Roosevelt took a significant step toward regulating industry in 1904. In that year the Northern Securities Case came before the Supreme Court, which ruled that this combination of railroads across the northern tier of the United States violated the 1890 Sherman Anti-Trust Act. The ruling established the right of the federal government to dismantle monopolistic trusts acting collusively to restrain trade, one of a series of groundbreaking precedents involving railroads set during the Roosevelt administration. Others included the 1903 Elkins Act ending rebates and the 1906 Hepburn Act empowering the Interstate Commerce Commission (ICC) to set maximum rates for carrying freight and people.
That might make you hesitant about investing in building new railroads.
Maybe this record is exactly what you would expect to see, given this set of issues — in other words, capitalism and free markets nimbly adjusting to changing conditions, producing the final end result of huge gains in productivity and wealth.
History happens; and it makes the lines squiggle. This irritates economists who think they are designing steam engines.
Although this “CPI and GDP” stuff is difficult, I think it is not too hard to answer our main question, which is: Did gold serve as a tolerably stable Standard of Value — in much the way that the floating fiat USD or euro serves as a standard of value for most of the world today? As I have already indicated, of the three incidents that people usually cite as potential deviations from this ideal, over the past 200 years, I have found nothing very convincing showing that gold had some deviation in value that caused big problems. It is not hard at all to find situations where floating fiat currencies had some big deviations, with big consequences; which you would expect, since the whole principle of a “floating fiat” currency is that its value changes.
As for employment:
3.3. Employment
Like the research on real GDP growth, unemployment rates were previously considered to be highly volatile during the gold standard period. That presumption has been dispelled by improvements in data quality, again based in large part on research by Christina Romer. Just as the traditional measures of economic production gave the false appearance of excessive volatility on the gold standard, Romer argued that the supposed stabilization of employment under the Fed was also simply “an artifact of improvements in data collection procedures.”
To resolve the data collection problems and improve on the faulty datasets, Romer created a dataset of revised unemployment rates from the Great Depression back to 1893. She found that the new data series exhibited much less volatility than the traditional measures. Employment was slightly more stable after World War II than before the Great Depression, but the difference is “reasonably small.” She found that the length of recessions and the relationship between GNP and unemployment were similar in both time periods. Based on this evidence, Romer concluded that “economists may need to revise their views of the prewar business cycle and especially of the change in the cycle over time.”
There is also a nice section on bank crises and bank regulations, which I will skip since I have quoted too much already. But it is worth reviewing. Basically, it makes the point that banking crises during the gold standard era don’t have much to do with gold, since other countries also on gold did not have these crises. It was a matter of domestic credit cycles, and institutional/regulatory details such as certain quirks of the National Bank Act. This contrasts with the floating fiat era, where big macroeconomic effects caused by large changes in currency values naturally have repercussions on the banking industry. This is most obvious in those many countries that have some kind of currency devaluation, creating havoc to credit conditions. But, it is also true of trying to undertake a banking business in an environment of a floating fiat USD or euro whose value goes up and down, a lot.
October 26, 2014: A Brief History of “Inflation,” 1949-2013
October 29, 2014: A Brief History of World Currencies, 1949-2014
Thus, we get the “right answer,” that the gold standard period was not so bad, and maybe had some advantages to the floating fiat era.
Conclusion
For most of its history, the U.S. economy operated on a gold-based monetary system. The market-based, self-regulating features of the gold standard effectively managed the money supply. The Federal Reserve has been tasked with managing the money supply in such a way as to stabilize prices and promote economic growth and stability, but it is far from clear that the Fed has achieved these goals. In this chapter, I have compared the pre- and post-Fed periods to assess the relative performance of the market-based gold standard.
Although many economists still believe the gold standard was a period of instability, research since the mid-1980s contradicts these views. In reality, the long-run price level was more stable and predictable on the gold standard. Although the volatility of inflation has declined in recent decades, the price level has become less stable and, hence, less predictable over longer periods of time.
Similarly, average rates of GDP growth were higher on the gold standard. Revised data shows that economic volatility, once thought to have declined under the Fed, is in fact quite similar to that experienced under the market-based gold standard. Recessions under the Fed have not become shorter or less frequent and employment does not appear to be more stable under the Fed.
But, I don’t think this line of argument is very productive, for the many reasons I’ve cited, and the reasons cited in the paper. Also, we never established the most important question: Did gold serve as an adequately stable standard of value? Nor did we even attempt to answer it. If gold did serve as an adequately stable standard of value, and we can find no example of any major problems caused by big changes in the value of gold, serving its role as a standard of value, then can we have any criticisms of the gold standard system at all — no matter what the “price level and GDP” data say? Even if the results were horrible, as in China during the Great Famine? This gets at a more fundamental question, which is: Hard Money or Soft Money? Classicals or Mercantilists?
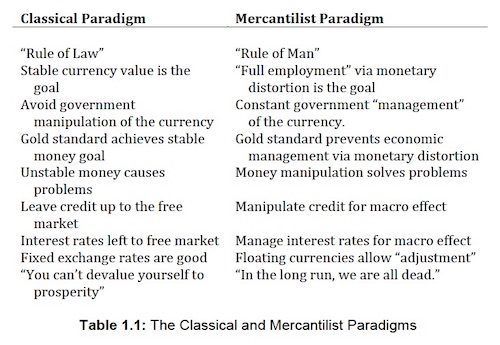
September 22, 2019: Let’s Talk About NGDP Targeting #2: The Classicals and the Mercantilists
Nevertheless, the paper does at least help dispel certain notions that the gold standard era before 1971 was some sort of catalog of monetary disasters, compared to our oh-so-superior floating fiat system. You could say, again, that it serves a sort of social role.
