
(This item originally appeared at Forbes.com on March 3, 2016.)
Academics often claim that today’s floating-fiat currency era has much more stable “prices,” at least in the short term (year to year), than the pre-1914 era of gold-based currencies.
For example, a February 2016 item by Russell Green, of Rice University’s Baker Institute for Public Policy, claims that “year to year short-run volatility [of prices] is higher than what a modern inflation targeting monetary policy produces.”
The problem is: What “prices” are you talking about? For recent years, it typically means some broad index like the GDP deflator or the Consumer Price Index (Baker uses the CPI).
However, none of these existed before 1919, when the Bureau of Labor Statistics began to compile a crude version of the consumer price index. The modern CPI really dates from a major revision in 1940. The GDP deflator began to be compiled by the government in 1947.
The “prices” that they are talking about, for the pre-1914 era, are basically commodity prices. In the case of the U.S., it typically means the Warren Pearson Index, compiled in 1933 by two academics. The Warren Pearson Index consists of commodity prices in New York. The actual weightings in the index were: 25% farm products, 25% foods, 10% building materials (lumber), 10% textiles (wool and cotton), 10% fuel, 10% metals, 4% hides and leather, 3% spirits, and 3% everything else.
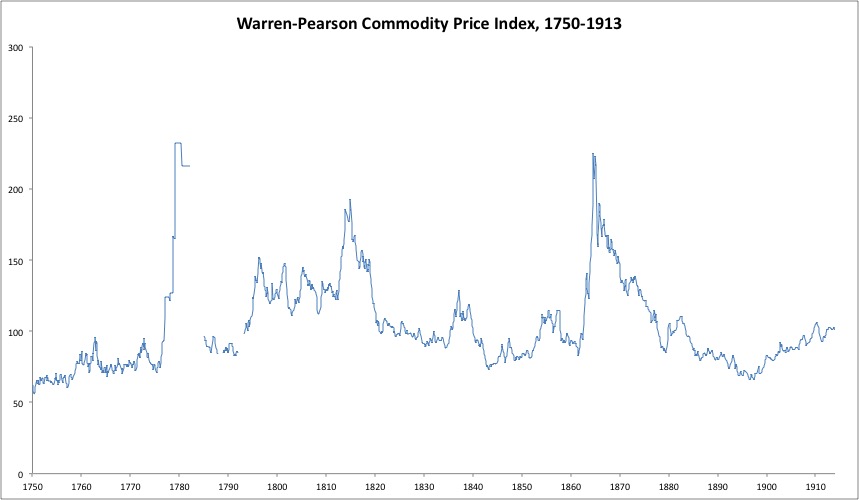
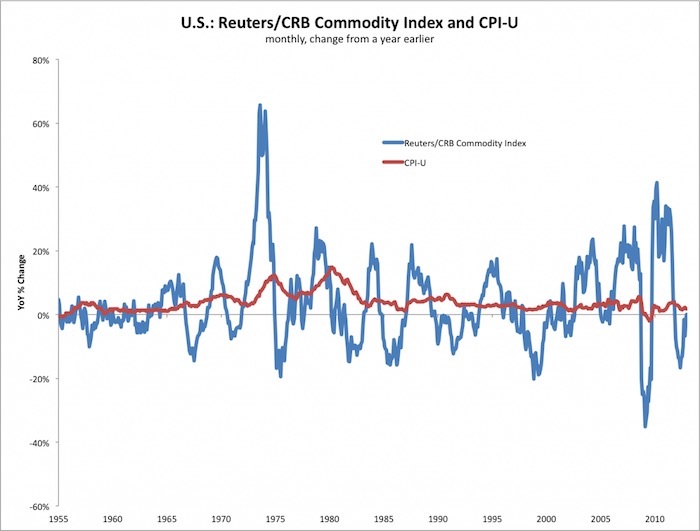
Basically, it is a commodity index, and one weighted heavily toward agricultural commodities. A commodity index, like today’s CRB commodity index, naturally has much higher volatility than a CPI-type index. For example, since 1970, the standard deviation in year-to-year change in the CRB commodity index has been 14.67%. The standard deviation in the CPI during the same period was 3.02%.
Not the same thing. At all.
For the period 1880-1913, the standard deviation in the Warren-Pearson Index was 6.74%.
So, on an apples-to-apples comparison, we have 14.67% volatility in commodity prices 1970-2015, and 6.74% in 1880-1913.
Obviously, commodity prices were much more volatile in the floating-currency era since 1971.
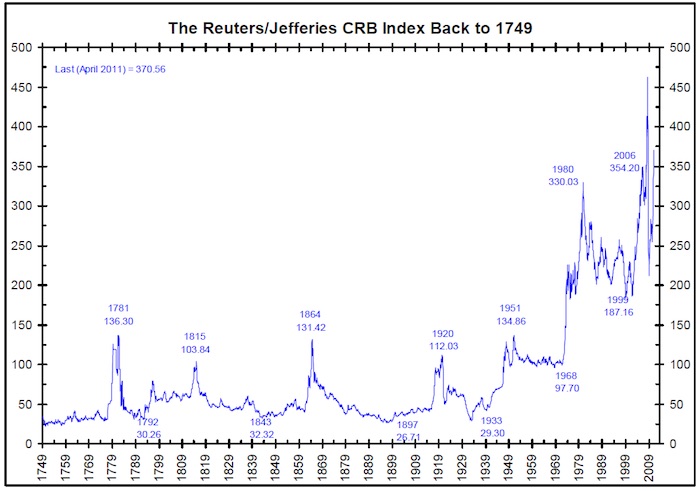
In the longer term, commodity prices were basically unchanged during the 1880-1914 period, but rose by an average of 4.5% per year in 1970-2015. That’s the long-term loss of currency value.
Which makes perfect sense. A floating currency goes up and down in value – from first principles. A gold standard currency is intended to be as stable and unchanging as possible. You should be able to guess the outcome from that description alone.
And, you would guess right.
This item generated a response from Russell Green:
My issue brief doesn’t use the Warren-Pearson index. Nobody would, though Mr. Lewis claims it is the “typical” source. It is explicitly a commodity index, like CRB, and both include gold as important components. Neither have much relationship with the cost of living, which is what most people care about.
My piece uses a CPI based on data carefully collected from historical newspaper clippings, mail-order catalogs and other sources, attempting to be geographically representative. The link to the data is in the issue brief. It isn’t perfect, but it’s way better than comparing commodity indices, especially ones that include gold.
I stand by my claim that using a CPI, the year-on-year instability of prices was higher during the Classical Gold Standard than in the modern era 1985-2015.
These criticisms are fair enough. I wasn’t aware of such an index, so I looked into it. Here is a description of the “CPI” data from measuringworth.com, which is cited as Green’s source:
https://www.measuringworth.com/docs/cpistudyrev.pdf
From this document, we find a hodgepodge of various price studies, none of which cover the entirety of the pre-1913 period. One study from 1977 (David and Solar) covers 1774-1851. There is another study by Burgess from 1920 (prior to Warren and Pearson) that coveres 1841-1920. Aside from those two, the rest are a hodgepodge of shorter time periods. The most detailed is Reese (1960), based on mail order catalogs, newspapers etc., and covering the “expenditures of 25,440 families” (it would be interesting to find out how someone in 1960 would follow the expenditures of 25,440 families in 1890). This seems to be the one that Green refers to. This data set covers 1890-1914.
But, none of that is so very important. Let’s just look at what the measuringworth.com “CPI” index looks like. Here it is, compared to the Warren Pearson Index.
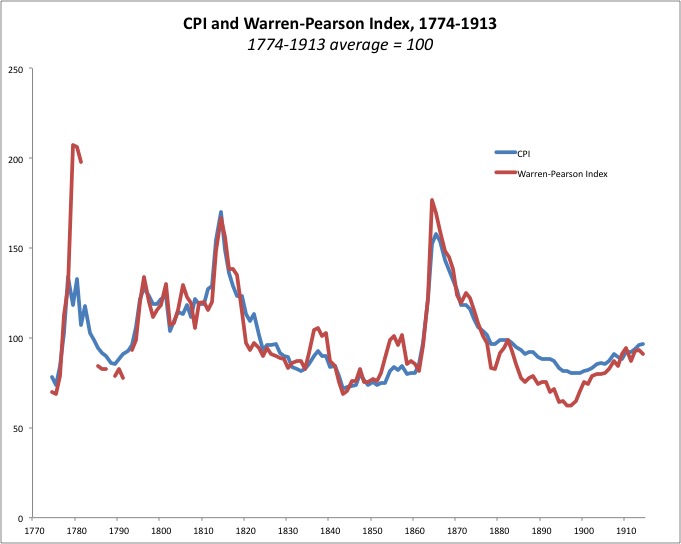
As you can see, it is virtually the same before 1880. During the 1880-1913 period, it is notably more “damped,” but still pretty similar to the Warren-Pearson Index in broad characteristics.
Now, let’s look at the CRB commodity index (the modern equivalent of the Warren-Pearson Index) and the official CPI.
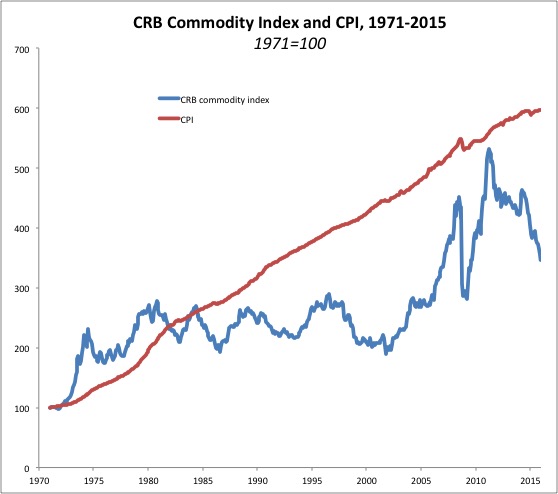
As you can see, the CPI is by now extremely “damped”, following the CRB index only in the longest timeframe, somewhat like a thirty-year moving average.
I think you will agree, the “CPI” of the 1880-1914 period, and the 1971-2015 period, are very different. It is not supposed to be the same, of course. Many of the things people spend money on now did not exist in 1880. Even today, the official CPI of many emerging market countries, like Indonesia or Ecuador, are much more closely correlated to commodity prices, simply because food and fuel make up more of people’s expenditures. Also the CPI is very different today than it was, for example, in 1980. John Williams of shadowstats.com has documented this in great detail.
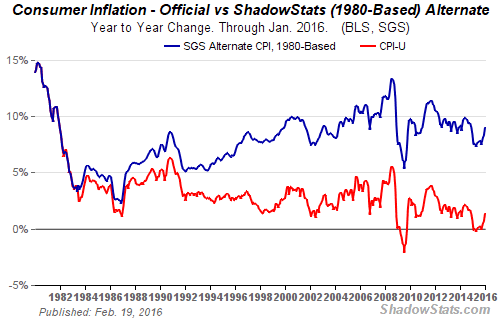
The “1980-based” CPI here is calculated exactly as it was in 1980, without all of the changes that have taken place since then.
Since 2005 or so, the CPI has become so heavily managed that it is regarded by many as an outright lie. Basically, propaganda. So, that is an interesting topic too.
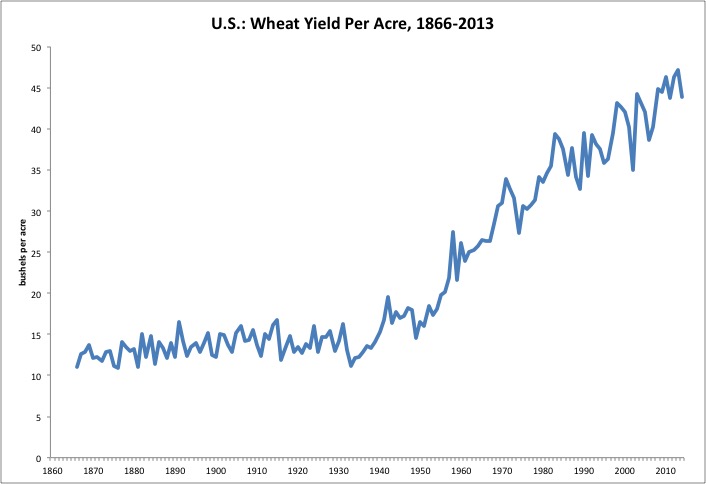
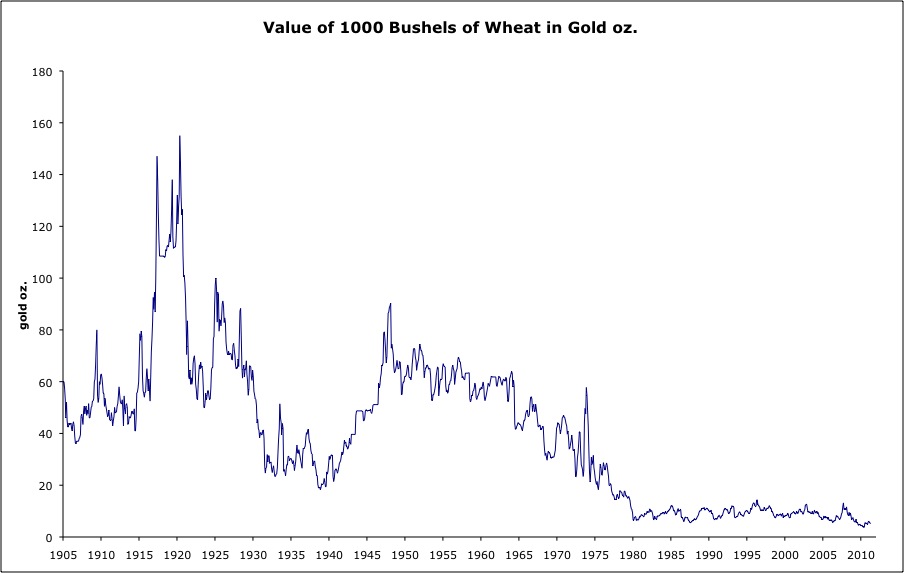
All of this is a good reason to look at commodity prices, as some reflection of monetary conditions, rather than the “CPI.” Even commodity prices are not really comparable in the long term. The increase in yields-per-acre for wheat or corn since 1950 have led to a huge decline in the market value of wheat and corn, compared to gold, which was not the case in the past.
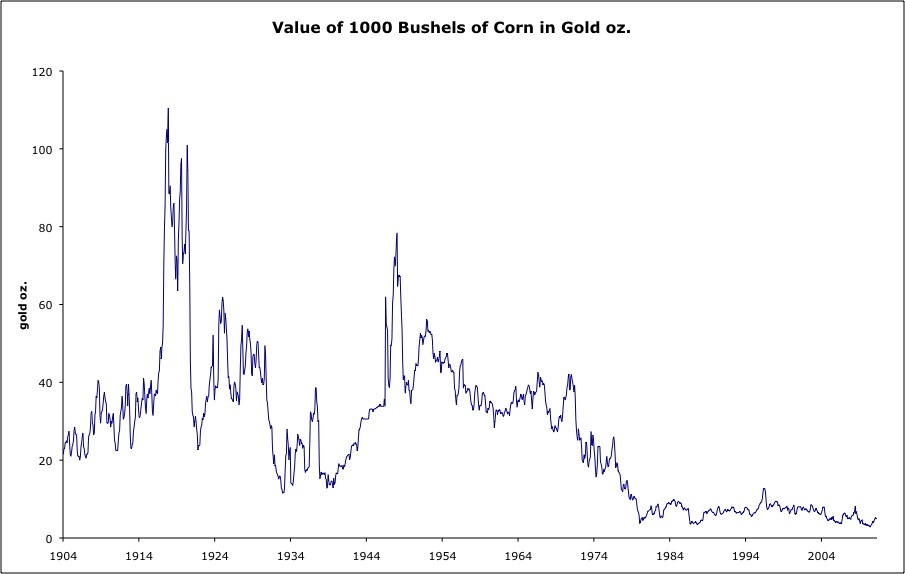
Oddly, this decrease in commodity values compared to gold has also extended to the metals such as copper, which certainly are the same as 100 years ago. Why?
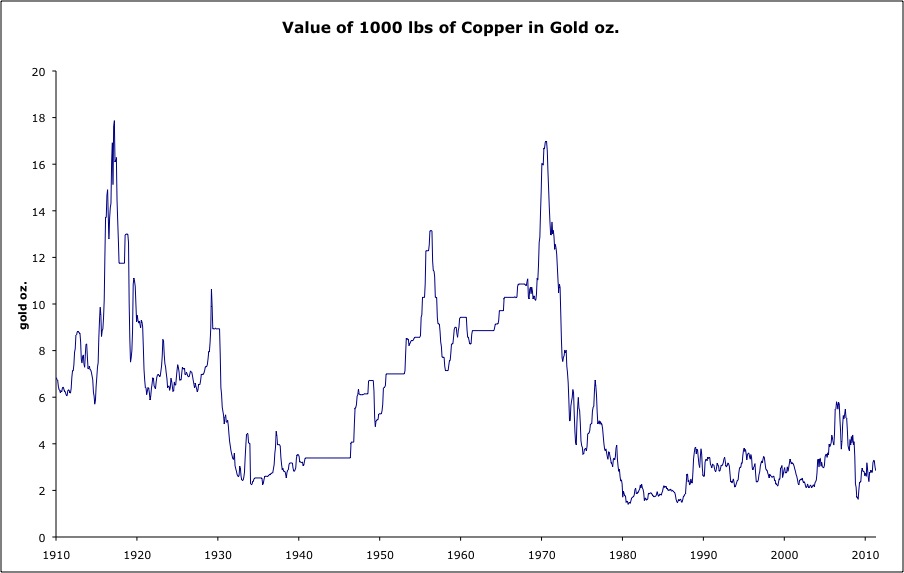
I suspect one reason is that mine financing (debt) has been inflated away, thus rendering mines solvent at a lower real copper price. Also, due in part to the volatility of commodities prices since 1970, I would guess that the returns on capital in the mining industry have been well below average. In other words, the price of copper is below the production cost and a reasonable return on capital. In the 1970s, for example, there was a huge expansion in mining industries (including energy), prompted by the inflationary conditions of the day. This increase was not caused by any actual real-world demand for more commodities. If anything, demand was depressed by the poor economies of the time. But, the nature of the mining industry is that it has big upfront costs — exploration and production — and then lower continuing costs for production. Once a mine is built, it keeps producing even if the selling price does not justify the upfront sunk costs. Typical mine life is in the realm of thirty years.
What to make of all this? There are no special conclusions. “Price stability” is not really a goal of a gold standard system. Rather, the goal is stability of monetary value, so that prices can be reflective of real supply/demand issues for that individual commodity or good or service, without distortion from monetary factors. The 1880-1914 period was actually a time when there were very dramatic real supply/demand issues for commodities, related to excessive worldwide investment in the 1860-1890 period. If gold was serving its purpose as a stable measure of value, then we would want commodity (and other related) prices to fall, as a reflection of that oversupply, which would naturally halt further investment and expansion. Prices could then recover back toward long-term averages, which is exactly what happened. Perhaps there was a monetary factor going on too, related to the expansion in gold production after 1896. These issues were discussed somewhat, such as here:
November 21, 2015: Let’s Resolve the Gold Standard “Deflation” Fallacy
February 26, 2012: The 1890s
August 17, 2014: Gold Holdings of Central Banks and Governments 2: The Larger View, 1850-2000
So, “price volatility” during the 1880-1914 period is not necessarily reflective of a failure of gold to serve its role as a stable measure of value. However, I think that the much higher commodity price volatility after 1971 is certainly reflective of the floating currency environment since that time.
In the end, the question is still: “what prices?” The “CPI” of 1880-1914 is obviously very different from the “CPI” of 1971-2015 (or 1985-2015), even if they have the same name and are part of the same series. (Of course, they are not part of the same series, but actually cobbled together from many series.) The commodity price series, the WPI and CRB, are much more similar, and thus more useful for these historically-distant comparisons, it seems to me.
