
U.S. Current Accounts and Bullion Flows, 1821-1900
March 4, 2012
A while ago, we looked at the history of current account balances and bullion flows for the United States during the 19th century.
September 18, 2011: U.S. Balance of Payments During the 19th Century
There’s a silly notion that a gold standard system causes “balanced trade.” Why this should be, I don’t know. Don’t you think that the U.S. maaaaaybe had some “unbalanced trade” in the 182 years of gold standard usage (with lapses) from 1789-1971? How about Britain, during its 233 years of gold standard usage?
I put the available data in some graphs to look at. Remember, any trade statistics and GDP statistics from the 19th century are going to be pretty hypothetical. So, don’t take them too seriously. But, they are the best we have and they give us some idea of what was going on in those days.
Also, remember that the U.S. was actually off the gold standard system from 1861-1879, so there’s a big floating-currency period in there too.
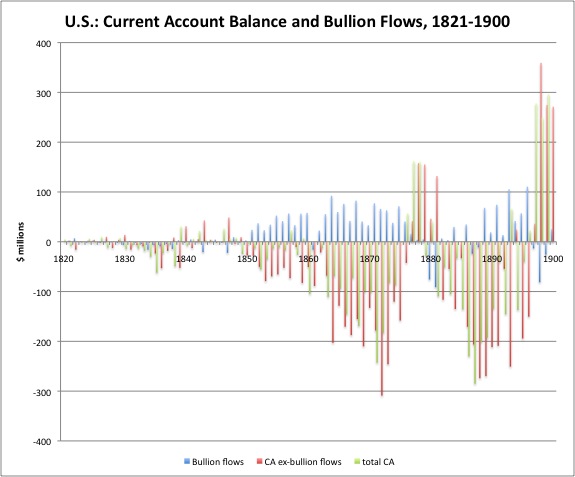
Here’s what it looks like. This is in millions of dollars. The blue is bullion flows. A positive denotes an export. The red is the current account balance ex-bullion flows. The green is the current account balance including bullion flows.
First, we see that there certainly wasn’t “balanced trade,” because the red and green bars are all over the place, instead of flatlining near zero.
However, there is some negative correlation between the blue bars (bullion flows) and the red bars (CA ex-bullion flows). This, I think, is mostly a coincidence.
The blue bars start to become strongly positive in 1850. Why? Gold was discovered in California in 1849. There was more coming out of the ground than people needed, so they exported it.
Beginning in 1860, we again see big exports of gold, and big imports of everything else. This was, of course, the Civil War. During such a war, a) domestic gold holders decide that maybe they should ship their gold overseas to Europe, and invest in British Consols or something safe like that (the reverse flow happened during World War II); b) foreign investors have no interest in sending any gold to the war-torn U.S.; c) there are a lot of things to pay for in wartime, so people with gold sell it to buy something they need. When we return to the gold standard in 1879, and the period to 1900, there’s a lot less correlation.
Here’s the same graph, represented as percentages of estimated GDP.
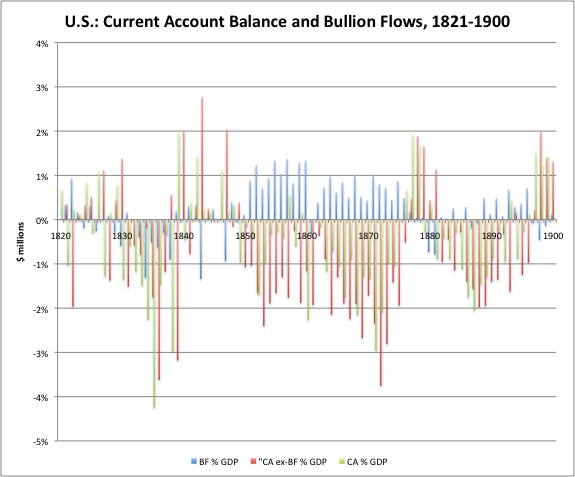
We see that current account deficits were commonly on the order of 2% of GDP, and sometimes hit 3%. The U.S. was a growing economy in those days, and they needed lots of capital. Europeans were eager to invest in the exciting New World.
