
We have been looking at the behavior of banks, as it relates to reserve balances held at the Federal Reserve.
May 26, 2019: The Federal Reserve and Bank Reserves
It turns out that I did look at these issues earlier, in 2013:
November 3, 2013: What’s Going On At The Fed?
Today, we will continue with our story. First, let’s look at basically the same data as we looked at last week, but in terms of nominal figures instead of a percentage of total assets.
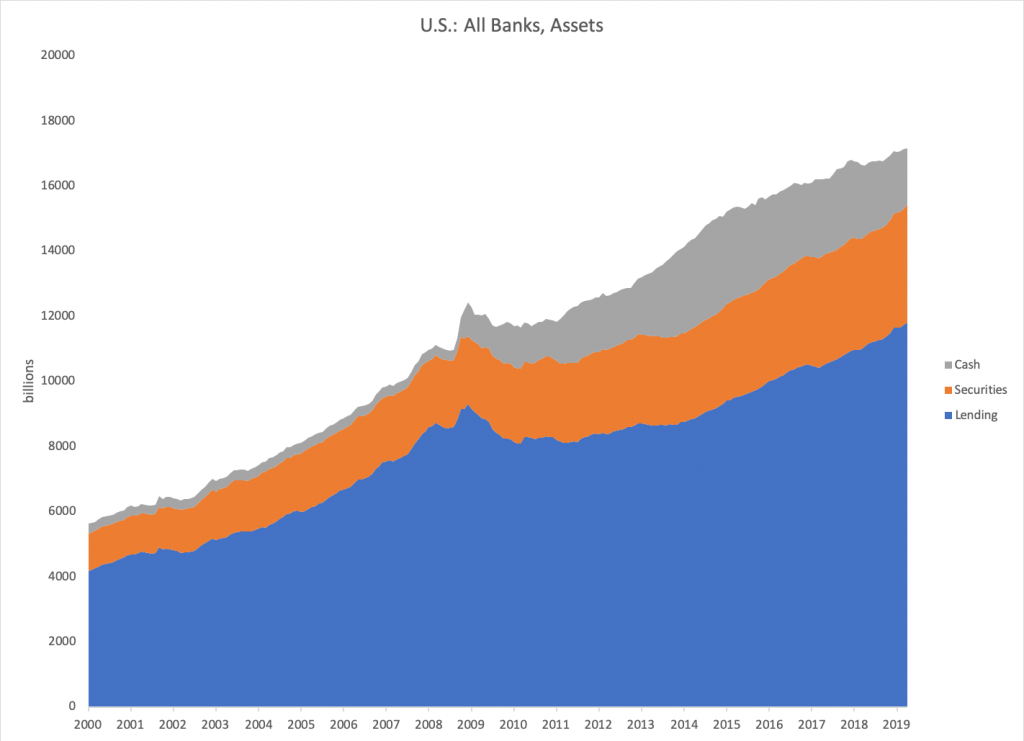
Here we see the same basic pattern, namely that “cash assets” increased a lot after the 2008 crisis.
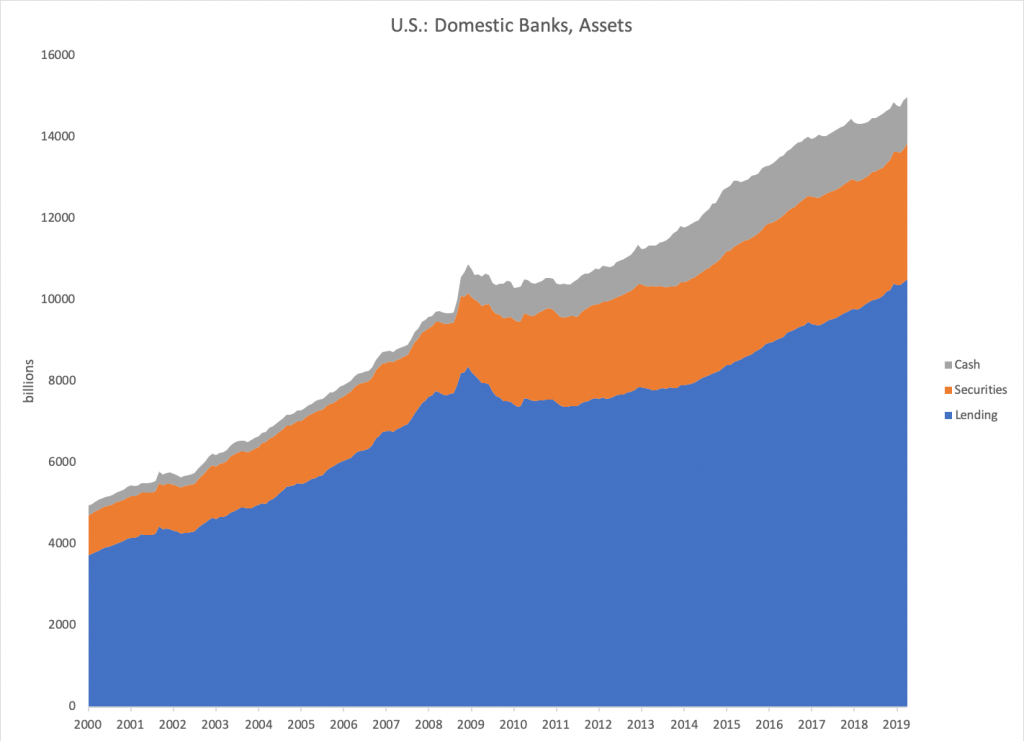
This is how it looked for domestic banks.
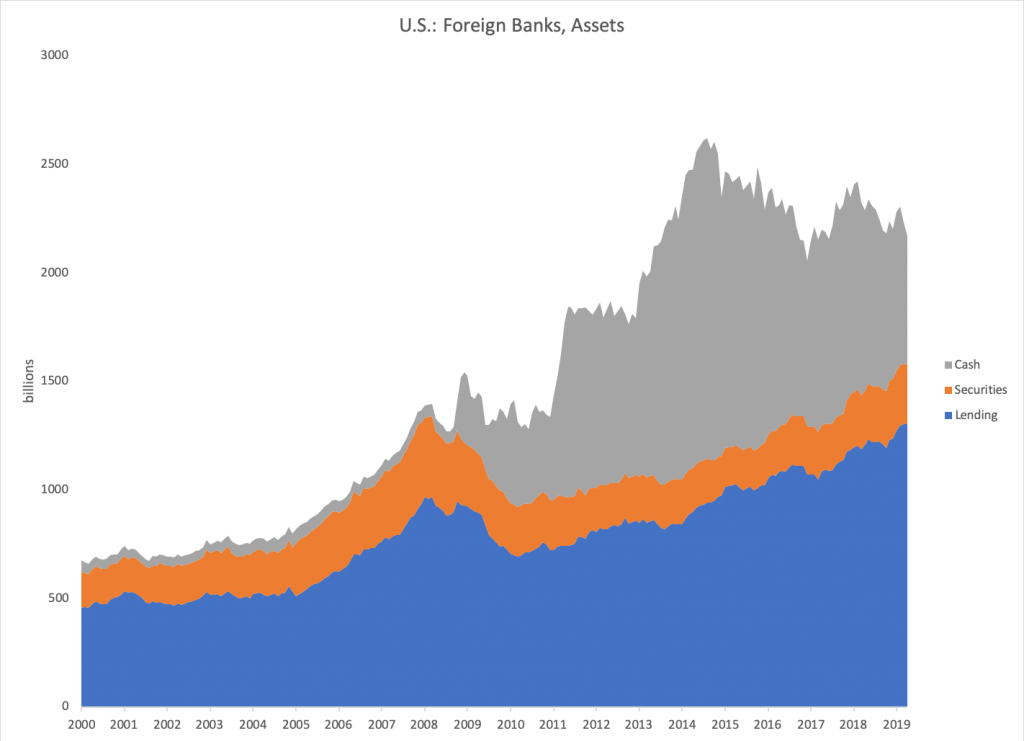
And, this is how it looked for foreign-chartered banks. Remember, these “foreign chartered banks” are basically divisions of foreign banks. This represents only a portion of the total balance sheet, the portion that is held on the balance sheet of the U.S. subsidiary.
We saw earlier that “cash assets” have been generally about 10% of total assets, although this had a steady decline in 1970-2008 to about 5%. This basically represents banks trying to squeeze out a little more profit. The downside is that it makes them more vulnerable to withdrawals. Risk increases. Apparently, many years of success emboldened them to take more risk. This is a common pattern in banking: they take more risk in the good years, and then are overexposed when things turn and blow up. Managements are forced along these lines, because they will either get fired or the bank will be acquired if they fall behind industry norms.
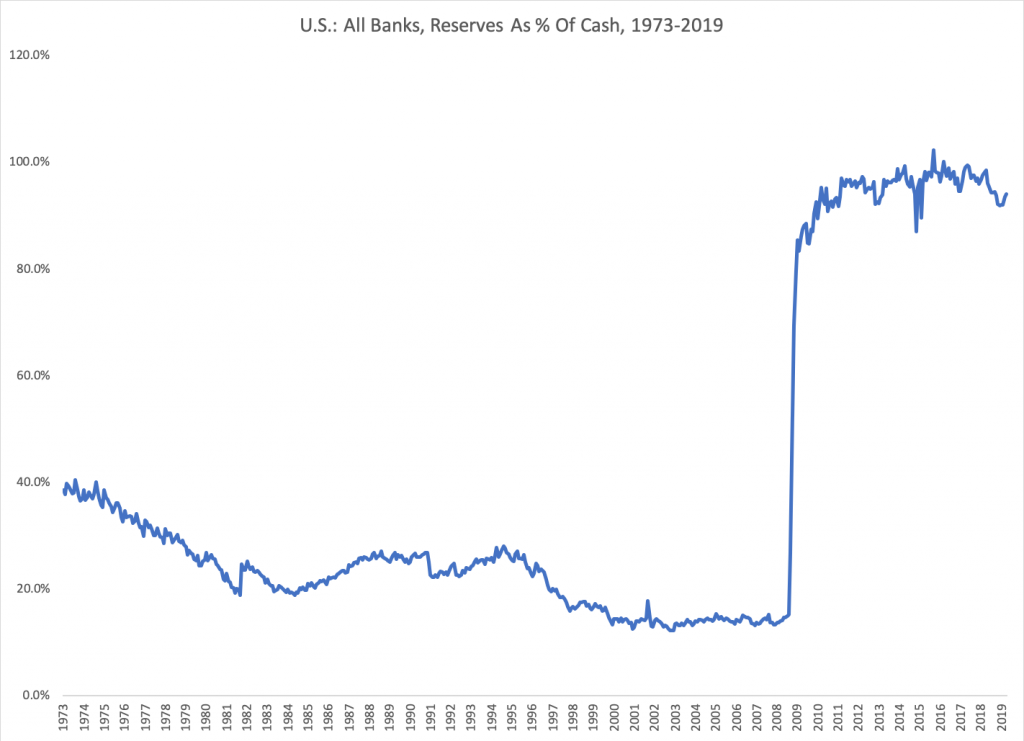
“Cash assets” basically consists of reserves held at the Federal Reserve (a portion of base money, and the only part of the balance sheet that is real “cash,” i.e., can be used to make a payment). Much of the rest consists of overnight lending to other banks and nonbank financial institutions (such as broker-dealers or non-depository lenders). Here we see the ratio of reserves (Fed deposits) as a percentage of “cash.” It began around 40% in 1973, and then fell to about 15%. So, we had a combination of “cash” falling from about 10% of assets to about 5%, and then a pattern of “reserves” falling from about 40% of “cash” to 15%. After 2008, “cash” goes to about 100% “reserves.”
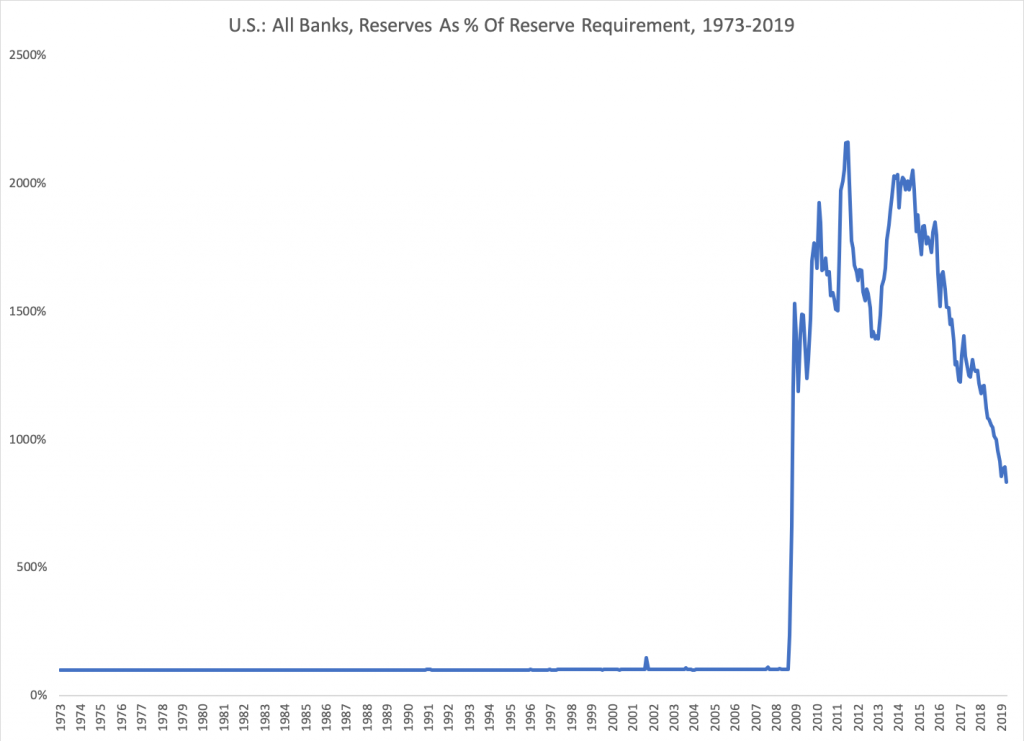
Here we see that banks’ reserves at the Fed were basically the same as the required reserves for a long time. Only after 2008 do banks hold reserves in excess of requirements. This basically reflects the desire for maximum profitability. Reserves held at the Fed normally did not pay any interest, just as a stack of $20 banknotes in your drawer does not pay interest. Banks would rather lend the money out overnight, and make a little interest, just as you might want to put your $20 bills in a money-market fund.
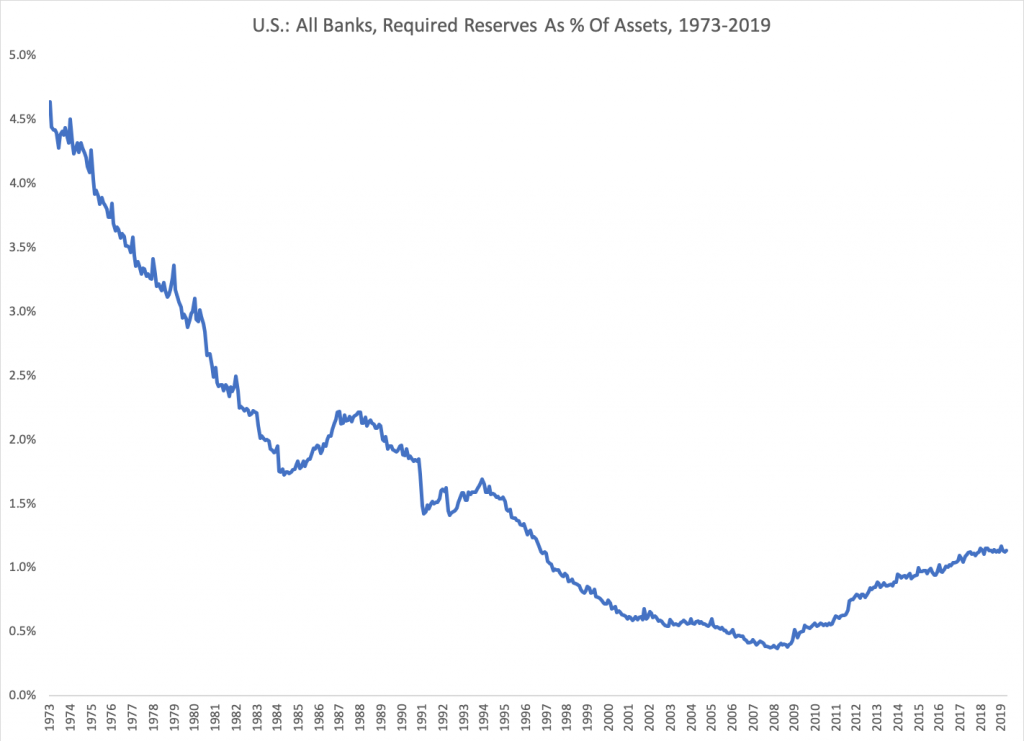
Here we see that required reserves fell from about 4.5% of assets to about 0.4% of assets. Probably this reflects continued pressure from banks to lower reserve requirements, since they likely seemed excessive and unnecessary at the time. But on top of this, banks did some tricky business to lower effective requirements. The reserve requirements for checking accounts are higher than for savings accounts. Banks got around this by setting up a secret savings account (separate from any savings account the customer may establish) for each checking account, and automatically sweeping the money into the savings account. Here is how it was described by Citibank:
“For accounting purposes, all Citibank consumer checking accounts (Regular Checking, Citigold Interest Checking, Interest Checking and Basic Banking Account) consist of two sub-accounts; a transaction sub-account to which all financial transactions are posted; and a holding sub-account into which available balances above a pre-set level are transferred daily. Funds will be transferred to your transaction sub-account to meet your transactional needs. For Regular Checking and Basic Banking Account, both sub-accounts are non-interest bearing. For Citigold Interest Checking and Interest Checking, both sub-accounts pay the same interest rate. Transfers can occur on any business day. Transfers to the holding sub-account will be made whenever available balances in the transaction sub-account exceed a preset level. Transfers from the holding subaccount to the transaction sub-account will be made whenever transaction sub-account balances fall below a predetermined level. Because banking regulations limit the number of transfers between these types of subaccounts, all balances in the holding sub-account will be transferred to the transaction sub-account in the sixth transfer in any calendar month. Both sub-accounts are treated as a single account for purposes of the client’s deposits and withdrawals, access and information, tax reporting, fees, etc.” (Citibank Client Manual p. 19-20/33, 2009)
There are some interesting conclusions we can come to from this. For one, we see that “money multiplier” theories look pretty absurd. You probably read in a college textbook that banks hold about 10% of “reserves” for every dollar of deposits, creating a “money multiplier” of 10:1. But, the real reserve/deposit ratio was more like 200:1! And, this didn’t really matter very much. I don’t think that banks’ balance sheets changed very much, in terms of total assets and liabilities, with the reduction in reserve holdings, except for the aforementioned increased risk from holding so little reserves. So we see that the chain of causality actually goes the other way: banks decide how much reserves they want to hold, and, via a variety of mechanisms, the Federal Reserve provides this. Within a fixed-value system (such as a gold standard or currency board), this desire from banks to hold reserves is one component of overall “demand” for base money, which is accommodated by adjustment of supply at the fixed value parity. Thus, we can see the mechanism by which the central bank indeed accommodates banks’ demand for reserve balances. In a floating fiat environment the process is rather more cloudy. Typically, banks’ desire to lend out excess reserves would tend to depress the overnight lending rate; or, their desire to hold more reserves would increase the overnight lending rate; and this would be accommodated via the Federal Reserve’s overnight lending rate target. There could be other mechanisms as well: a declining dollar value (reflecting supply of base money in excess of demand) could lead to curtailment of base money creation within the context of the floating fiat currency; and likewise for a rising dollar. This is basically the same mechanism as the gold standard/currency board, but in an informal seat-of-the-pants framework rather than the rigorous automatic system of a fixed-value system.
It would be nice if we could just let banks do what they want, and forget about “reserve requirements” which are problematic for a variety of reasons. But, it appears that without requirements, banks would hardly hold any reserves at all, perhaps due to competitive pressures, this producing the risky situation that prompted the introduction of such requirements. Part of the problem here is that banks are no longer managed by their owners, as was the case in much of the 19th century — the agency problem which comes up over and over in finance. Owner-managers would be happy to have some reduction in profitability for reduced risk. Hired managements, however, tend to be subject to short-term competitive issues and take on too much risk.
Unfortunately, these time series only go back to 1973, and it is apparent that already by 1973 there were some big changes happening in banks’ balance sheet management. I have some data going back to 1950, although it is not as detailed. The source is the NBER macrohistory database, available here:
NBER database on money and banking
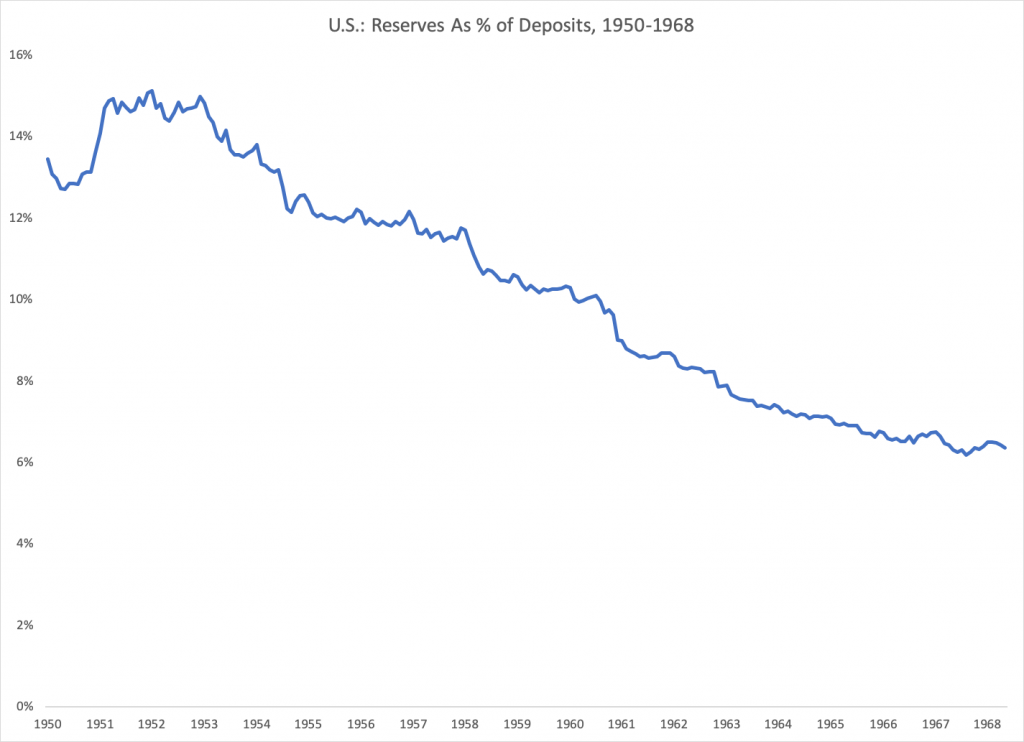
Unfortunately, I don’t have reserves (Fed deposits) as a percentage of Total Assets, as a convenient time series, so instead I will use Total Deposits, which is probably about 90% of total assets. We see here that Fed reserves began in the 1950s around 15% of Total Deposits, and somewhat less than this in terms of Total Assets, but still probably around 11%-12%. This is the “reserves of 10% of deposits” that you read about in college textbooks. Banks really were run in that way in the past. So, you can see that in the long term, we went from reserves of 10%-ish of assets in the 1950s down to about 0.5% in 2000-2008, which is certainly a little silly.
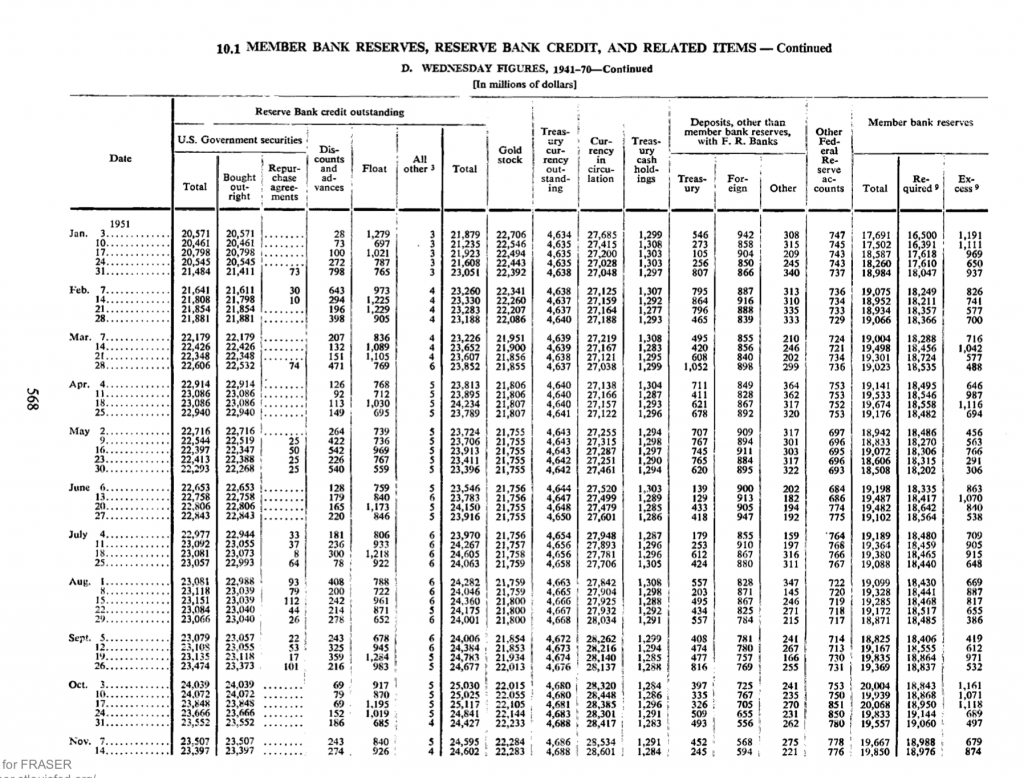
There are more detailed time series in the Banking and Monetary Statistics, 1941-1970, available here:
Federal Reserve Banking and Monetary Statistics 1941-1970
From this, we find Total Assets of Member Banks of $140 billion in April 1951. At that time, reserves were $19.141 billion, of which $646 million was in excess of required reserves. This is a reserve/asset ratio of 13.7%. So, at that time too, banks held little more than the requirement, but the requirements were very high!
Note however that “cash assets” remained about the same 10% throughout (I assume). So, if “cash assets” were 10% of assets, and reserves were about 10% of assets, then it follows that reserves were about 100% of cash, which is how it is supposed to be if you ask me. Reserves are the only “cash” that a bank can actually spend. After the Great Depression and World War II, banks were cautious. Already by the 1960s, however, banks were becoming more aggressive to improve profitability.
After 2008, “Cash” goes to 100% “reserves.” Basically, banks no longer want to lend out their cash as overnight loans for extra profitability. There are two reasons for this: one is that banks are now more cautious, and don’t want to bet the farm on overnight borrowers — a return to 1950s-like norms. Second, the Federal Reserve began to pay interest on overnight reserves, which is a new thing that did not exist before 2008. Now banks didn’t have to lend out the cash to make a few extra pennies. The Federal Reserve would pay them to hold balances at the Fed. Nice deal!
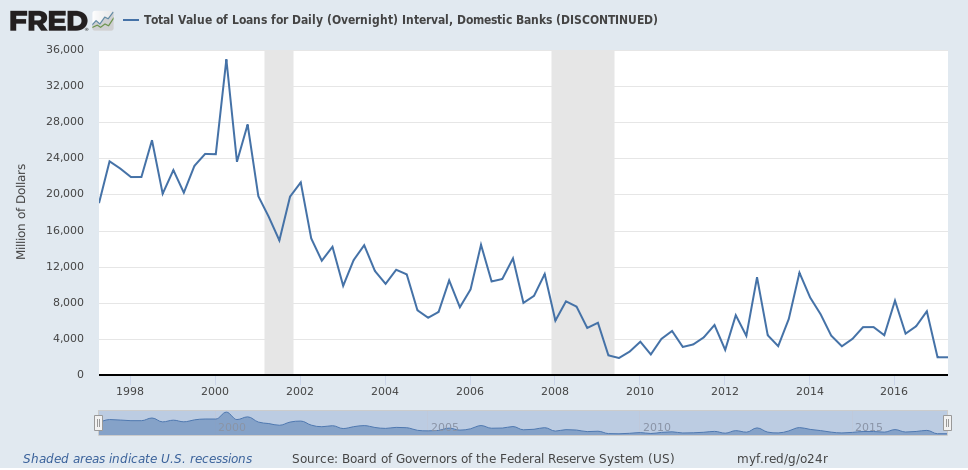
Here we see that banks’ overnight lending has fallen quite a bit.
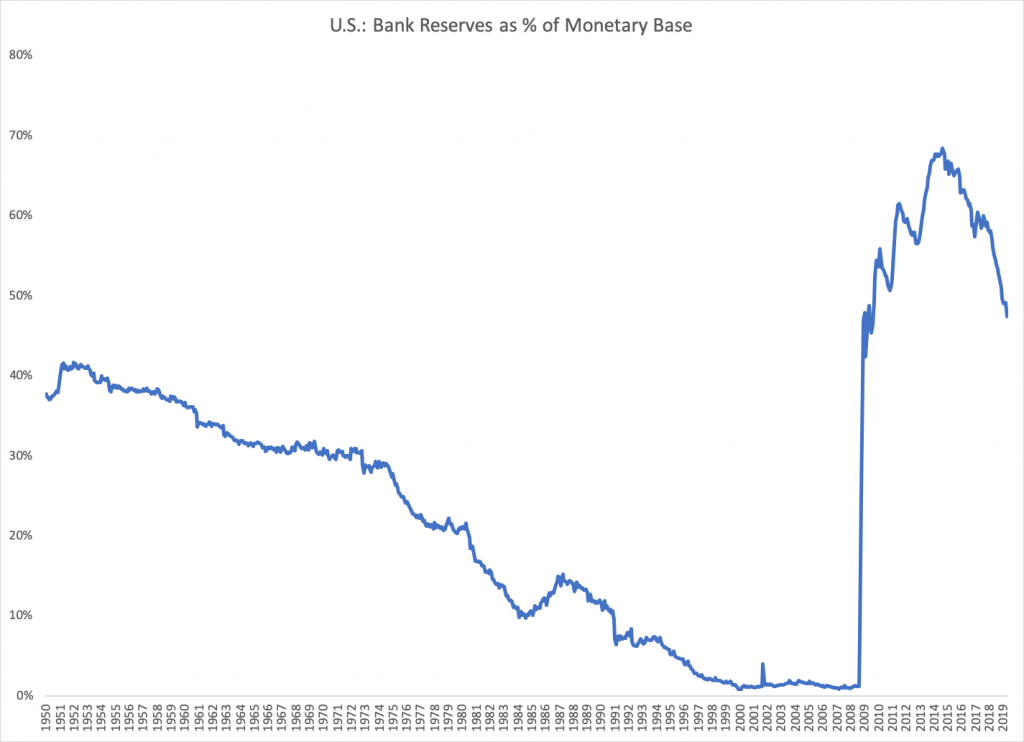
The result of all this is that bank reserves, as a percentage of the total monetary base, is high now but not so much different than was the case in the 1950s.
The Federal Reserve does apparently break out reserve holdings of foreign-chartered banks in detail. For example:
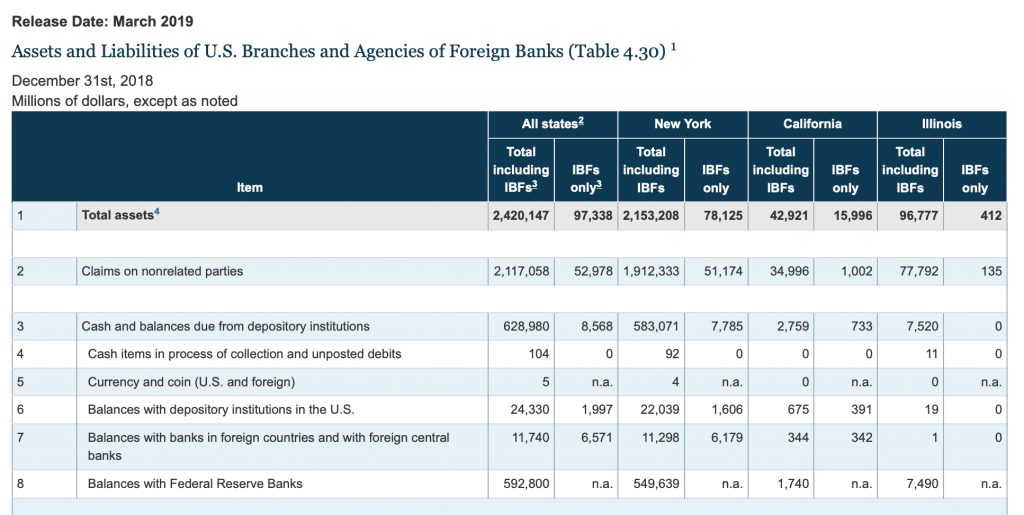
However, I have been having trouble finding a data series on this.
Again we will pause there, and continue with this topic in the future.
