The End of the 1972 Bull Market
December 25, 2006
I wish I had the time to really do a number on the events of 1972, which were the leadup into the disaster of the 1970s. Alas, it is better to at least put something out there, and it will be more than enough for this week anyway.
The 1970s started in January, 1970 (surprised?), when William McChesney Martin stepped down at the Federal Reserve and was replaced by Nixon’s handpicked inflationist Arthur Burns. Martin was heavily criticized — not surprisingly — for trying to support the dollar’s value against gold through a policy approach that drove the Fed funds rate to 10% and produced a recession and collapse of the housing market. Martin should have adjusted base money directly, which probably would have led to lower interest rates, instead of higher ones. Nevertheless, Martin’s strategy, though it blew up the economy, at least achieved its goal: in January 1970 the dollar traded at its promised $35/oz. of gold, for the last time. When Burns came in, the approach immediately tended toward “easing,” the Fed funds rate plummeted. This produced a decent recovery in 1971-1972, which helped Nixon get re-elected in 1972. However, the dollar’s value steadily sank, and in August of 1971 the US officially went off the gold standard. By the summer of 1972, the dollar touched $70/oz., losing fully half its value from the $35/oz. Bretton Woods parity, and insuring a corresponding 100% inflationary increase in prices going forward. Various commodity markets boomed. It was the highest gold price/lowest dollar value in US history. Wasn’t anyone paying attention?
Many were, and the warnings against the danger of inflation were plentiful for those that were paying attention. Most people, however, including most professional stock market investors, assumed that they were still in the prosperous 1960s, enjoying the Great Bull Market that had begun more than twenty years earlier. The “Go Go Years” were still in play, although the DJIA hadn’t made a new high since 1965, when it peeked over 1000 intraday but did not close above that level.
For years I wondered about this market. The inflation was really, really obvious. The central banks of Europe complained about it regularly. How could people have been so bullish? But, it must be said, business actually seemed to be going quite well at the time. I’ve concluded that:
1) Inflation can be quite wonderful for business — until it’s not, and
2) William McChesney Martin’s punchbowl analogies are appropriate. When the “punch” is “spiked” with an inflationary monetary distortion (in this case the decline of the dollar from $35/oz of gold to the $65/oz range), people get really happy. And sloppy. And they lose their inhibitions and have a big party. Investors are good at interpreting changes in market prices but they are not prepared (except for a few) to interpret changes in the value of the currency in which market prices are denominated.
Regarding #2, a Russian friend of mine was telling me about his experiences during the Russian hyperinflation in the early 1990s. Certainly the mood must have been dour? No, he said, people were thrilled! They were making more and more “money”!
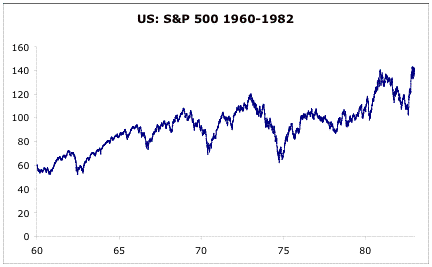
Then, it happened! Toward the end of 1972, the DJIA broke the 1000 level and made new highs! Need I say the mood was bullish? In January 1973, the DJIA topped out at around 1050, or about 5% above its 1965 high. On January 1, 1973, Barron’s published its famous Roundtable interviews with big-name professional investors. The title was “Not a Bear Among Them.” (By the way, the Fed Funds Rate, as of the end of December 1972, was — 5.33%! You can’t make this stuff up.)
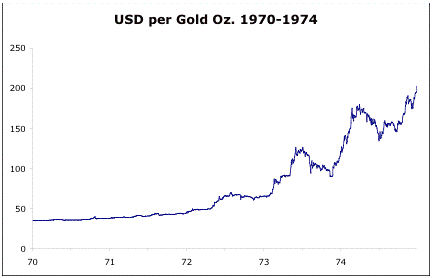
And that was it: the market started heading down, and as the already-existing inflation intensified in 1973 and 1974, the DJIA collapsed to under 600. In terms of gold, the DJIA went to about three oz. of gold (600 with the dollar at $200/oz.). For comparison, at the absolute lows of 1932, the DJIA was worth two ounces of gold. Thus, although the “headline” decline in the DJIA was about 45%, the “real” decline was more like 90%. Today, the DJIA is again making new highs, although at $620/oz. it is worth about 20 oz. of gold. At the peak in 1965, it was worth about 28 oz. of gold, so in actuality — adjusting for the devaluation of the dollar — the DJIA is well beneath its high point of over forty years ago. I will not be at all surprised to find that the DJIA is worth under four ounces of gold within the next three years.
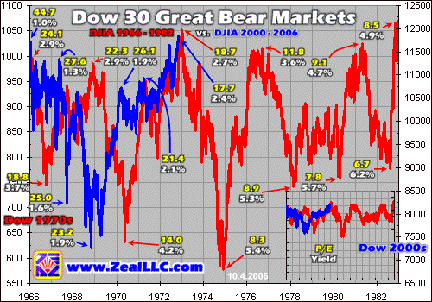
(nice commentary from Adam Hamilton: http://www.zealllc.com/2006/dowhighs.htm)
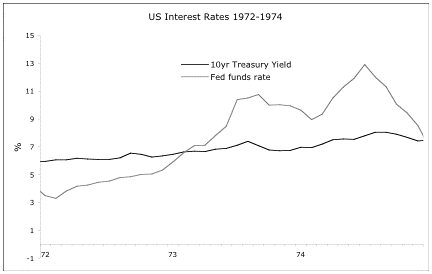
The Great Bull Market of the 1950s and 1960s had, at its foundation, a dollar pegged to gold (loosely at times) at the Bretton Woods value of $35/oz. The Great Bull Market of 1982-2000(?) had, at its foundations, a dollar that was vaguely stable around $350/oz. of gold. What a nice and convenient 10:1 ratio! Thus, when we look at these dollar moves of 1971-1972, and we see the dollar going from $35/oz. to $50/oz., that is comparable today of the dollar going from $350/oz. to $500/oz. Indeed, if we look at the gold/dollar chart, we see a fairly gradual move higher from $35/oz. ($350/oz.) to $50/oz. ($500/oz.). Then, when the $50/oz. ($500/oz.) level is breached, the market takes on a new character and makes a quick move to $70/oz. ($700/oz.). Then it consolidates sideways for several months, making a double bottom around $60/oz. ($600/oz.). During this period, the stock market is one big party. Then, we see a return to the old highs of $70/oz. and a breach of this level, followed by a very quick and dramatic move over $100/oz. ($1000/oz.). This is about the time when the stock market begins to fall apart, and the inflation of the 1970s reaches full bloom. The Fed — which remember had been easy-peasy since 1970 — then panics and drives rates over 10% toward the latter half of 1973. This blows up the economy and the stock market, but it does not resolve the problem of the declining dollar, which collapsed further into 1974. In 1974 the Fed ends up going to over 13% as the dollar goes to $200/oz. ($2000/oz.) and the stock market is pulverized.
During this time, president Nixon was impeached and resigned, while the US war in Vietnam finally collapsed in failure.
That was the First Act of the 1970s. There was an interesting recovery in 1975-1976, followed by another round of inflation in 1977-1980.
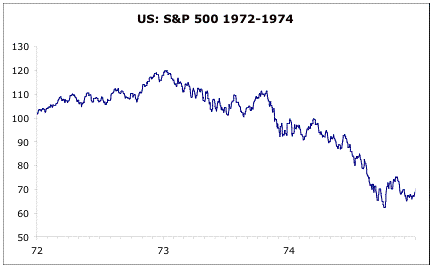
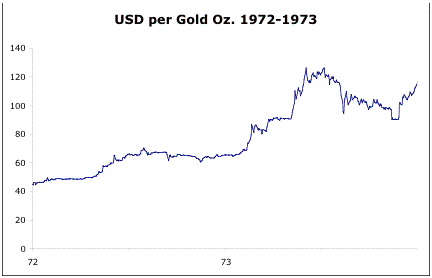 Hey, I think I’ve seen this movie before! There have been so many similarities to the 1972 period recently that I feel like I’m watching a Hollywood remake. If there are some interesting differences, they are:
1) There is WAAAAY more debt and derivatives out there than there were in the 1970s. Inflation is generally easy on debtors because it makes their liabilities disappear. Bankruptcy is generally not a problem in inflations. I haven’t studied the Weimar hyperinflation of 1920s Germany much, but I can just about guarantee that people didn’t have problems paying their loans back. However, this time, there may be enough macro turmoil that there will be a bankruptcy issue as well, particularly among consumers. Their wages don’t inflate higher very quickly, and in the meantime there could be job losses, not to mention ARMs adjusting higher. Do we even want to contemplate the consequences of a 10% Fed funds rate on the wave of ARM adjustments coming up?
2) Oil supply wasn’t really an issue in the early 1970s. The price went up simply because the dollar’s value went down, and consequently it took more dollars to buy the oil. Indeed, the result of the artificial inflationary price signal was that way too much oil was produced in the late 1970s-early 1980s, which was corrected during the latter 1980s. This is immediately apparent in a chart of world oil production. In terms of ounces of gold, oil’s “price” went down during the decade. However, there is a real petroleum supply issue today, and it will only get worse. Thus, we could see phenomenal rises in oil prices. At $1000/oz. of gold and 8 barrels/oz., we’re talking $125/barrel oil. At $2000/oz. and 6 barrels/oz. — entirely possible around late-2008 or 2009, although I won’t say it’s likely — that would mean $335/barrel oil, and $10 gasoline.
(see for example: http://www.peakoil.ie/downloads/newsletters/newsletter72_200612.pdf)
3) Housing valuations today are WAAAAY higher than in 1972, when they were still in recovery after being crushed in 1970. Houses soared higher in nominal value during the 1970s because they represented a hard asset, while payments on fixed-rate mortgages effectively dwindled away. Houses represented a major plus for many households during that period, and I don’t think they will serve the same role today. Whatever the nominal price of houses does (it may eventually head higher due to inflation), the valuation of houses (notably the price/rent ratio) will probably get smacked down hard to perhaps as low as 6x annual rents. Maybe as low as 4x!
(see for example: http://www.safehaven.com/article-6472.htm)
4) If there is one good thing today, it’s that tax brackets are adjusted for the CPI, thus minimizing “bracket creep,” a big source of effective tax hikes during the 1970s. Also, capital gains, though still not CPI adjusted, are taxed at much lower rates than they were then (35%-50%).
Thus, based on this analogy alone, we can create some hypothetical “back to the 1970s” scenarios for 2007:
1) The dollar will sink below its previous low of $730/oz. and head quickly to $1000/oz.
2) The stock market will begin to decline when the dollar makes new lows vs. gold, if not a bit sooner (maybe the $680/oz. region).
3) The Fed will eventually have to react to this monetary situation with some rate hikes, possibly taking the Fed funds rate to 7% or higher by the end of 2007. However, the Fed would like to remain easy-peasy, so it will generally be “behind the curve” in its actions.
4) “Goldilocks” will be dead as an investment hypothesis.
5) The S&P 500 will at some point be 20% below its high point for the preceding bull rally, but it may close the year down only 12% or so. In terms of ounces of gold, however, the losses for equities will be enormous (50%+).
6) Monetary order will be disturbed as the dollar makes new lows against foreign currencies in 1H07, Other governments will at first be willing to let the dollar sink. However, pretty soon (2H07) they will take action to prevent their currencies from rising too much against the dollar, with all the trade consequences that implies. Thus, all governments will effectively devalue their currencies alongside the dollar, producing worldwide inflation.
The thing that would really cinch a “back to the 1970s” outcome is new highs for gold vs. the dollar ($750/oz. or higher), setting off a very quick move to $900+. I think this is fairly likely going forward, although there are no certainties.

