
The Warren-Pearson Index
February 12, 2012
The most commonly used source of price information for the U.S. before 1920 is a series compiled by two academics, George Warren and Frank Pearson, from Cornell University. The U.S. government only began collecting such data in 1919, with the Bureau of Labor Statistics wholesale price index. This was not what we would consider a “consumer price index” today, but more of a commodity price index. The CPI as we know it was first introduced in 1940.
Warren and Pearson produced a book called Prices, published in 1933. In it, they introduce a price index going back to 1749. My main point today is that this price index, which is the most commonly used reference for “the price level” or “purchasing power” before 1920, is basically a commodity price index. The index is made up of eleven subindexes. The subindexes and their weightings are found below. The weightings apparently changed over time. The first number is the weighting in 1799, and the second number is the weighting in 1889.
Farm Products (35%/25%)
Foods (27%/25%)
Hides and Leather (5%/4%)
Textiles (8%/10%)
Fuel and Lighting (4%/10%)
Metals and Metal Products (4%/10%)
Building Materials (10%/10%)
Chemicals and Drugs (0.5%/1.0%)
House Furnishings (1.0%/1.0%)
Spirits (5%/3%)
Miscellaneous (1.5%/1.0%)
From this we can see that Farm Products and Foods were 62%/50% of the index. So, it is mainly a measure of farm prices. Energy, Metals, and Building Materials (mostly lumber) are another 18%/30%. Leather and textiles are 13%/14%. Everything else — mostly booze — is 8%/6%. The index was based on prices in New York. It was not a nationwide index. In the days of horse-drawn wagons on dirt roads, commodity prices would have quite a lot of regional variation due to the inability to cheaply transport them, especially farm commodities.
Obviously, this is nothing — nothing at all — like today’s Consumer Price Index. Today’s CPI-U has the following weightings:
Food and Beverages: 15%
Housing: 43%
Apparel: 3.7%
Transportation: 17%
Medical Care: 6.2%
Recreation: 5.6%
Education and Communication: 6.0%
Other: 3.5%
Here is what the Warren-Pearson Index looks like:
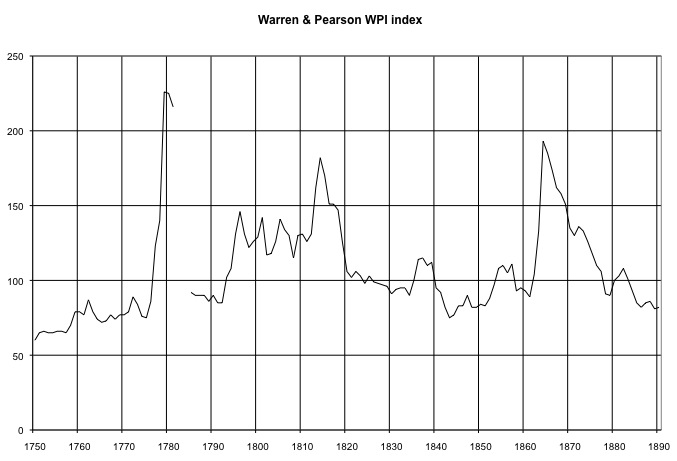
What do we see here? This is about what a commodity index would be expected to look like, in my opinion, if gold were stable in value. It ends at roughly the same level as it begins. There are three big spikes. The first (around 1780) corresponds to the devaluation of the Continental Dollar.
November 27, 2011: The End of the 1970s Gold Bull (includes bonus graph of the devaluation of the Continental Dollar).
The second is a plateau corresponding to the Napoleonic Wars in Europe (possibly creating demand for commodities), leading to the War of 1812 in the U.S. which involved a partial devaluation of the dollar. Then there is a slow, decades-long return to roughly 1770-era prices. Of course there is a big spike in the Civil War, related to the devaluation of the dollar during that time, and then a return to prewar prices right in line with the return to the gold standard system in 1879.
Here is a longer commodities price series, which we’ve seen before. It looks like they also used the Warren-Pearson index before 1914.
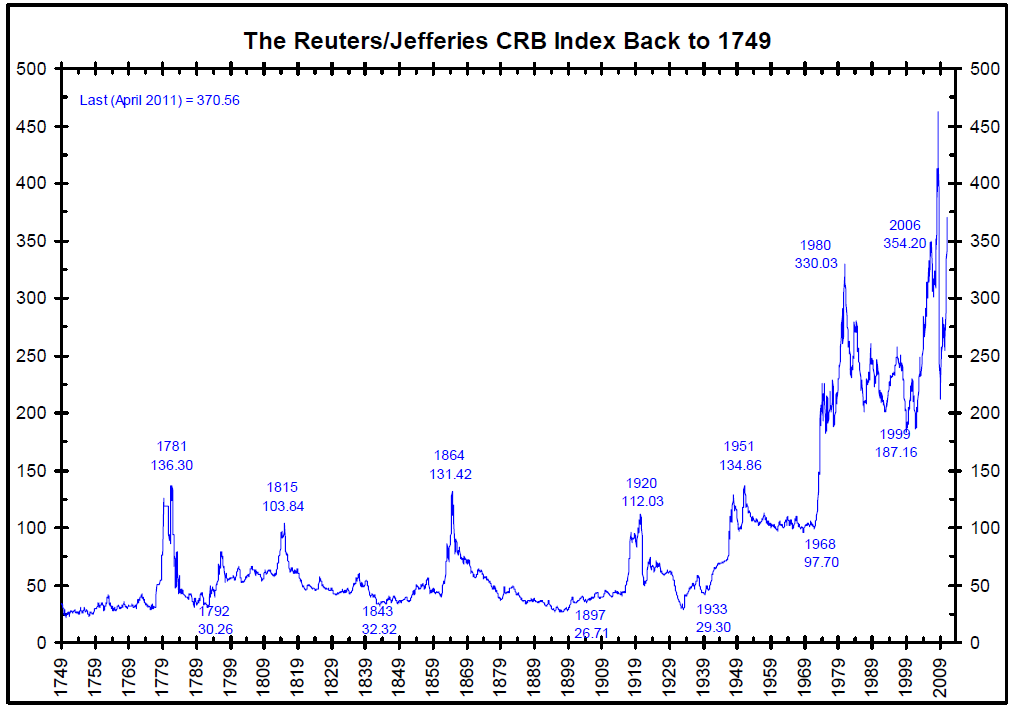
I bring this up in part to show additional war-related rises in commodity prices, particularly in World War I. This was a combination of both demand for commodities from Europe, and also some devaluation of the dollar during the war years.
The dollar was, of course, devalued in 1933, to $35/oz. from $20.67/oz., but the effects of that devaluation didn’t fully pass through to commodity prices until the demand created by World War II. We have a new plateau during the Bretton Woods years, and then of course the chaos of the floating currency era since 1971.
If you mentally compensate for some of these episodes of war and devaluation, I have to say the index looks remarkably stable to me. Remember the time frames we are dealing with here. A decade fits into a centimeter. Yes, the index might move 30% over a decade, but that averages less than 3% per year. Also, these are commodity prices, not today’s CPI, so it is supposed to have a fair amount of volatility.
The declines in commodity prices to relatively low levels in the 1840-1860 period and the 1880-1900 period are related to the expansion of farmed acreage during those placid peacetime years, especially in the U.S. This was exacerbated by the rapid expansion of railroads, which allowed these farm products to be effectively moved to a central market such as New York. While the huge expansion of farm produce was of great benefit to non-farmers, many farmers got themselves into trouble due to the heavy new supply and resulting low prices. Thus, there is something of a business cycle here: somewhat higher prices for farm products encourages people to put more acreage under cultivation; the increased supply and consequent falling prices puts an end to the overexpansion of farmed acres. People can only eat so much, you know.
I will have some interesting statistics on this business cycle, regarding the 1880-1914 period. Here are some preliminary details to whet your appetite:
June 5, 2011: Gold Is Stable In Value 4: More Commodities Prices, and Commodity Baskets
Unfortunately, these price indices are put to rather stupid uses. It is an old rhetorical trick of the Keynesians to claim that “prices during the gold standard era were highly volatile.” They are trying to imply that this commodity price index bounces around a lot more, year to year, than today’s CPI index. Well, of course it does. They are measuring different things.
Another rhetorical trick is to imply that the “value of gold” was bouncing up and down, basically as the reciprocal of this price index. The “value” of gold is immediately equated with the “purchasing power” of gold, and the “purchasing power” of gold is immediately equated to the price of corn and wheat in New York. We are supposed to believe that a 30% rise in the price of wheat and corn (remember, the Warren Pearson index is mostly farm products) is thus equivalent to a “30% decline in the value of gold,” or that a 30% decline in the price of wheat and corn is a “30% rise in the value of gold.” Obviously, this is stupid. But, it has served its purpose over the years, as a means to influence public policy along Keynesian lines. Actually, it hasn’t served so much as an influence of public policy, but more of a justification for what politicians wanted to do anyway, which was devalue the dollar during recession.
The better classical economists have been pointing out this fallacy for literally centuries:
Here’s David Ricardo in 1817:
Remember that David Ricardo didn’t just dig this out of the ether, he was responding to the intellectual debates of his day. Things haven’t changed much, have they?
Here’s a similar passage from Ludwig Von Mises, dating from 1949:
Political justification was the main purpose of Warren and Pearson’s book. Note the publication date: 1933. That was the year that the dollar was permanently devalued for the first time in U.S. history. If Warren and Pearson were actually influencing and leading public policy, the book would have been published in 1920, and it would have taken thirteen years for its intellectual effect to spread. Its publication after the process of dollar devaluation had already begun shows us that its main purpose was political justification, rather than innovation or inspiration.
January 26, 2012: Gold Standard Vs. a Commodity Basket Standard
This was not the first time such rhetorical tricks had been used. The 1890s were another time of declining commodity prices due to oversupply, causing marginal farmers to default on their mortgages. The Democratic Party wanted to fix this with a 50% dollar devaluation, which goes by the term “free coinage of silver.” So, in a sense, this was the second time around for the Democratic Party, this time via Roosevelt rather than William Jennings Bryan.
Of course, the Great Depression was another time of collapsing commodity prices. Warren and Pearson wanted to “stabilize prices” by way of managed dollar devaluation. They speak glowingly of a proposal at that time by John Maynard Keynes:
I bet that was a popular notion, considering that the Roosevelt administration had already begun just that.
Warren and Pearson then quote Keynes for more details:
“Whilst it would not be advisable to postpone action until it was called for by an actual movement of prices, it would promote confidence and furnish an objective standard of value, if, an official index number having been compiled of such a character as to register the price of a standard composite commodity, the authorities were to adopt this composite commodity as their standard of value in the sense that they would employ all their resources to prevent a movement of its price by more than a certain percentage in either direction away from the normal … Actual price movements must of course provide the most important datum; but the state of employment, the volume of production, the effective demand for credit as felt by the banks, the rate of interest on investments of various types, the volume of new issues, the flow of cash into circulation, the statistics of foreign trade and the level of the [stock] exchanges must all be taken into account. The main point is that the objective of the authorities, pursued with such means as are at their command, should be the stability of prices.”
Obviously, what we are talking about here is currency manipulation in response to economic conditions. However, you can imagine that, after 144 years of a dollar worth $20.67/oz. (with some lapses), not to mention a dollar worth the same during the Colonial period, many people weren’t so gung-ho about currency devaluation as Mr. Keynes. Thus, we see an adoption of vaguely classical, gold-standard rhetoric (“stable prices”) as a justification for currency manipulation and devaluation. Actually, the goal of a gold standard system was never “stable prices,” which is silly, but rather a stable value of the currency. Prices would be free to go up and down, in response to supply and demand factors, as measured in a currency of stable value.
Even gold standard advocates get a little caught up in this sort of silliness. I would note Roy Jastram’s book The Golden Constant, which, although somewhat gold-friendly, tends to make the same mistake of equating gold’s value with its “purchasing power” vs. a basket of commodities.
Fortunately, we aren’t so stupid today. At least, I’m not.
