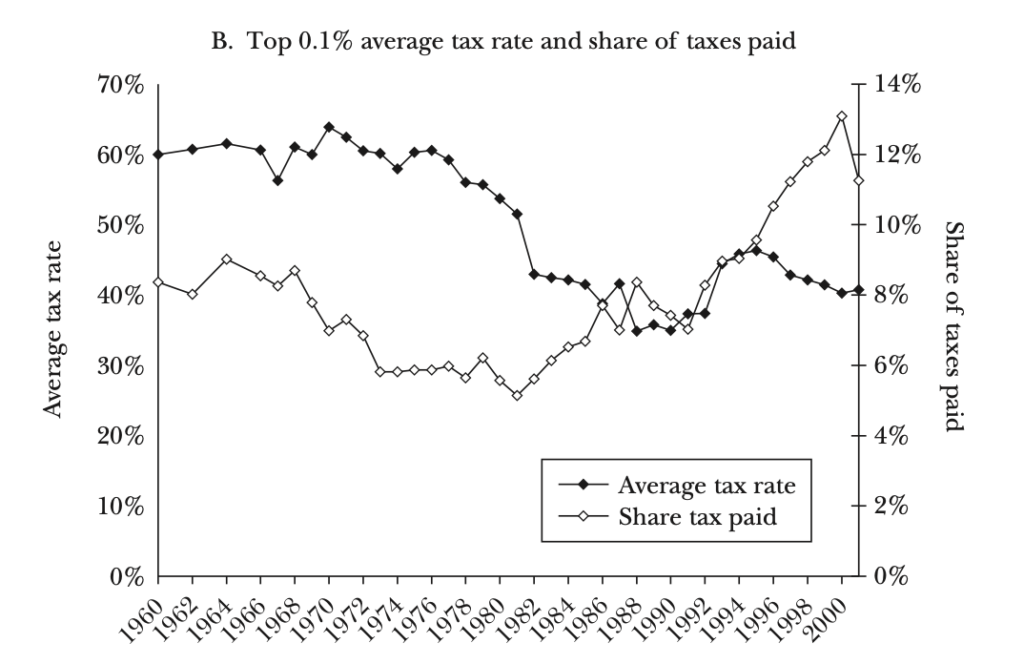
Here is a very interesting graph sent by a friend of mine, with full sourcing:
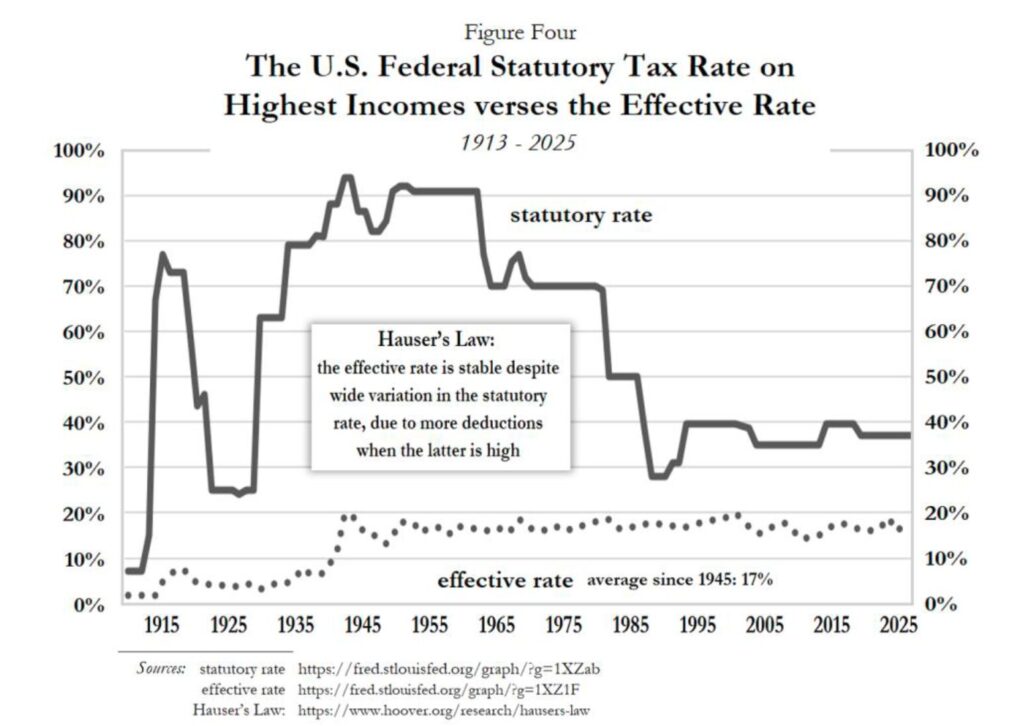
Here is a link to the report (by David Ranson) at the Hoover Institute:
UPDATE: This does not actually measure what I thought it did, which is the effective tax rate on higher incomes, after all the deductions and exemptions. The “effective tax rate” in this chart is merely total Federal tax revenue/GDP, including all payroll taxes. It is still a good message, maybe the most important — namely that higher rates have never led to higher tax revenues, in the US from 1945-present; and that lower rates have never led to lower revenues. Nevertheless, it made me interested in the original question, namely the “effective tax rate” on the highest incomes. “The highest incomes” inevitably includes a lot of one-time members of the 1% club, including inheritances or big capital gains reported from the sale of a house or a company. It’s not just a kind of wage income, such as for a basketball player or a CEO. But let’s see if we can find some info on that statistic.
Here is some data from the Tax Foundation:
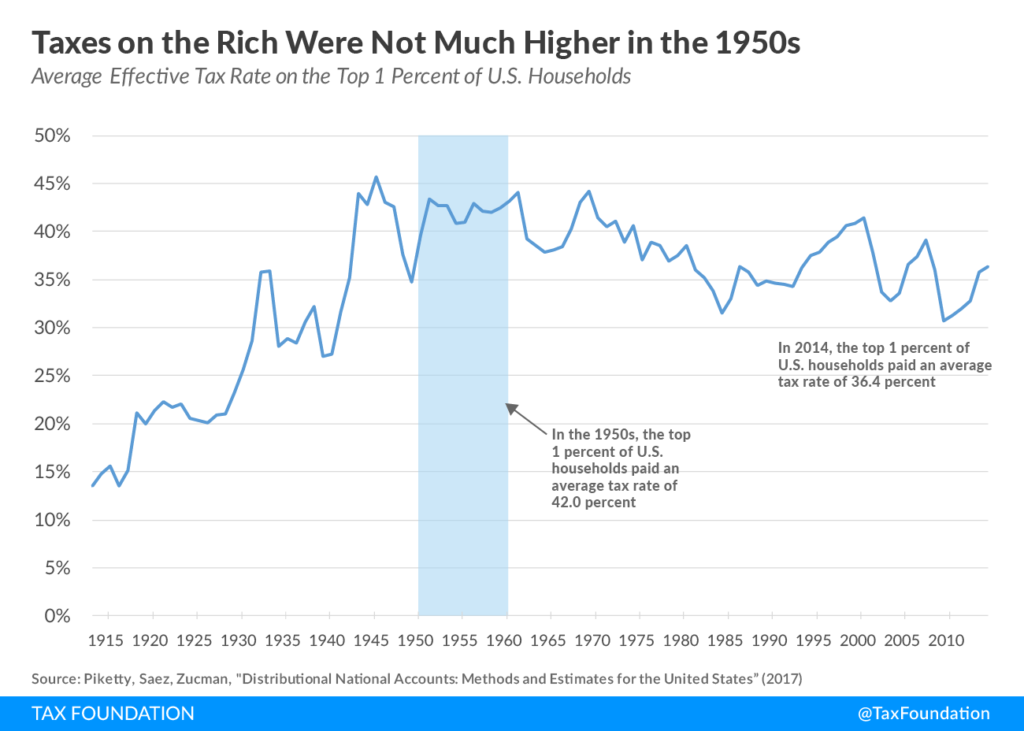
More data is available here.
This still doesn’t really capture what I was looking for. Just as you might expect, higher tax rates make the tax base shrink.