
We’ve been looking at what the Federal Reserve was doing during the 1920s.
November 25, 2012: The Federal Reserve in the 1920s 2: Interest Rates
November 18, 2012: The Federal Reserve in the 1920s
This week, we’re going to look at the Fed’s balance sheet (sort of) itself.
Here is the source of the data:
http://fraser.stlouisfed.org/publication/?pid=38&tid=21
These are some funny statistics. First, the assets and the liabilities don’t balance. Second, the “balance sheet” includes Treasury monetary obligations, including gold and silver certificates, silver coins, and National Bank notes. On the asset side, the balance sheet consolidates the gold bullion associated with those Treasury obligations. An odd way of doing things. Nowhere does it show exactly how many Federal Reserve Notes were in existence.
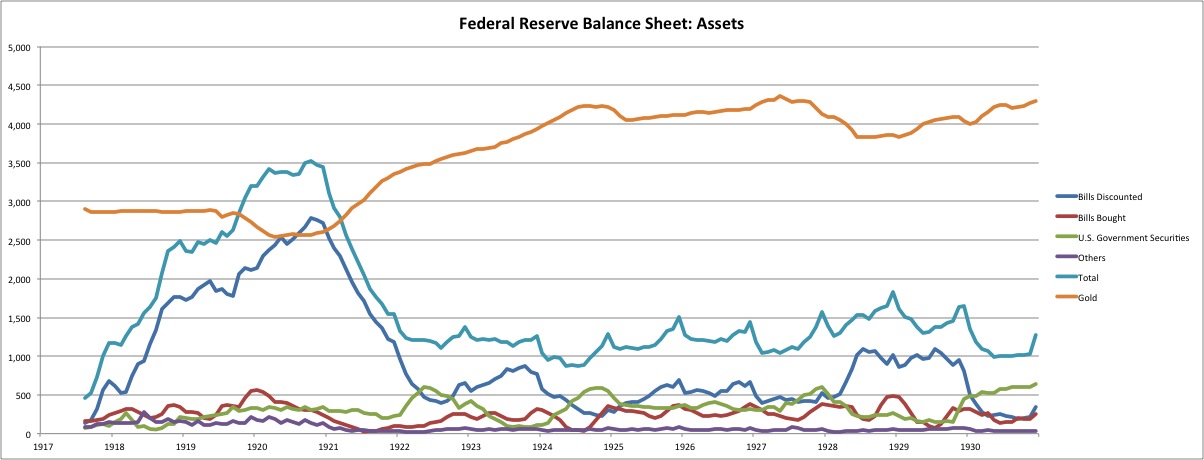
A reminder again: there was some funny business going on during WWI and afterwards. The Fed (as you can see) engaged in aggressive bank lending (“bills discounted,” i.e., collateralized lending), as part of a program with the Treasury to keep interest rates low.
March 25, 2012: The U.S. Dollar During WWI and the Recession of 1920
This was remedied in the 1920-1921 period. Normalcy didn’t really return until 1922. Let’s forget about that 1917-1922 period for now.
As we can see, gold assets generally rose in the early 1920s. The Fed maintained a consistent amount of “Fed credit,” i.e., either lending or purchases/holdings of debt assets, either “bills bought” (commercial paper) or U.S. Treasury securities (government bonds). The mix changed, but the total amount was fairly stable around $1,250 million. Total Fed credit dips a bit in 1924, and surges a bit in 1928.
This was consistent with the way the Bank of England and other commercial banks (such as those thousands of banks that were part of the National Bank system) operated. They were involved in the market every day, making loans or buying and selling debt assets. The Fed was not really intended to do this, but, considering the precedent and also the role it was pushed into during WWI, it is not too surprising that it happened.
Previously, I called this a “hybrid system,” which included both purchases and sales of gold bullion at that parity price, and also purchases and sales of non-bullion (loans and debt) assets, to adjust the monetary base.
January 15, 2012: Gold Standard Technical Operating Discussions 2: More Variations
January 8, 2012: Some Gold Standand Technical Operating Discussions
This hybrid system was the most common framework for entities that managed a currency directly, rather than pegging it to some other gold-linked currency (i.e. a currency board).
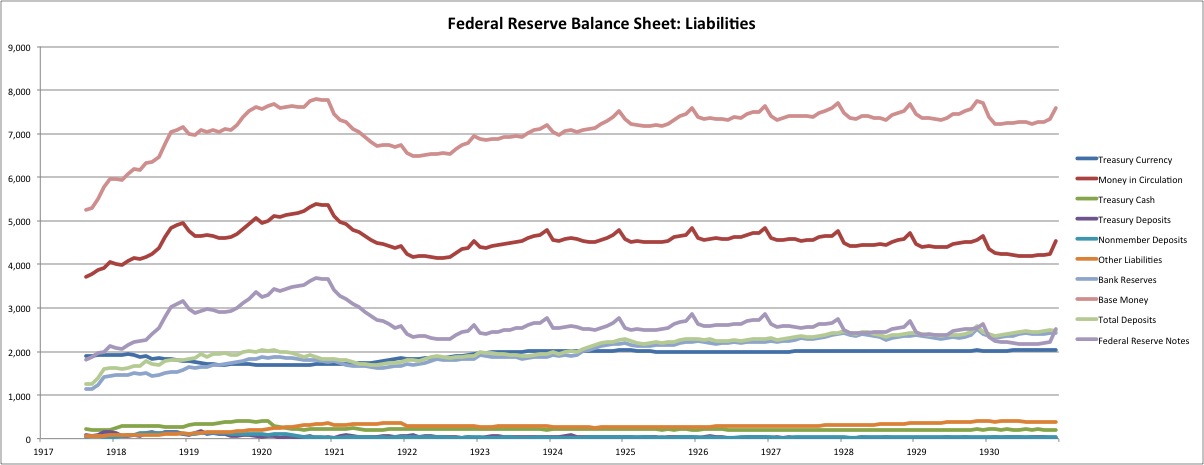
Here is a chart of the Fed’s liabilities, including also “Treasury Currency” as mentioned before. The total base money, including Treasury currency, is the top line in pink. Federal Reserve Notes are approximately the difference between “Money in circulation” and “Treasury Currency.” Bank reserves are barely visible, hidden by total deposits. This is because bank reserves made up about 98% of total deposits, the remainder being deposits of the Federal government, and a bit of deposits from other entities (likely foreign central banks).
Liabilities are well in excess of assets. Like I said, the balance sheet doesn’t balance. This is due, I think, to the consolidation of “Treasury Currency” on the balance sheet. Bullion assets related to “Treasury Currency” (including National Bank Notes) are listed in assets, but non-bullion assets (bonds) held by currency-issuing National Banks, and the implied credit of the Treasury, are not listed on the asset side. Thus, system-wide, there were more credit assets used as currency reserves than are listed here.
We see a bit of seasonality here. This is the seasonality of base money demand, with the spike around harvest time that sometimes caused liquidity shortage crises in the past, notably in 1907. (The seasonality apparent in this chart is not very great, especially compared to bank reserves. Reserve requirements and other factors seem to have played a major factor in the incidence of liquidity shortage crises, including in 1907.)
This seasonality is accommodated largely through the issuance of Federal Reserve Notes, as Treasury Currency doesn’t change much. On the asset side, there’s a corresponding seasonality to Bills Discounted and Bills Bought.
There’s a bit of a lift in total base money in 1922-1925, which corresponds to the lift in gold assets during the same period. Apparently, people were bringing gold to the various currency issuers (Treasury, National Banks, and Federal Reserve) and getting banknotes in return.
The story here is, for the most part, one of placidity. As mentioned, there were two minor wiggles, in 1924 and 1928. In 1924, Fed Credit dips down a little bit, and gold surges up a little bit. Apparently, there was a reduction in credit assets for some reason, which, by itself, would have resulted in a reduction in the monetary base. This was apparently countered by the automatic mechanism of gold redeemability/monetization (in this case monetization), which corrected the reduction of the monetary base with a corresponding expansion, such that total base money is largely unchanged (or rather, continues the smooth curve characteristic of the time period). This makes sense: base money demand would not be expected to change just because the Fed is moving assets around. The system automatically corrected for this. It seems that some observers (Friedman) called this “sterilization,” because gold holdings go up while base money (“high powered money”) is largely unchanged. However, I would say that it appears that the mechanism of gold redeemability/monetization was fully functional, and was responding as expected to the changes in the Fed’s holdings of credit assets.
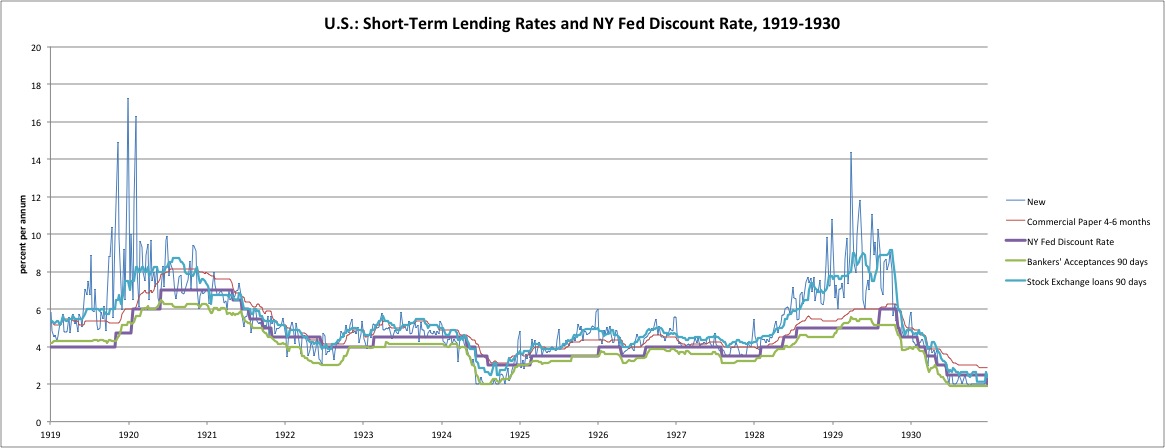
The reason that Bills Discounted (i.e., bank lending) falls is likely that market overnight rates fell well below the Fed’s discount rate, as you can see on our previous chart of interest rates. At this point, borrowers would not go to the Fed, and existing loans would mature and not be renewed. Thus, lending would contract naturally. The question then is: why did overnight interest rates take a dip in 1924? This could be because of additional base money creation from some other means, such as purchases of Treasury securities. The additional base money would end up as bank reserves, banks would have more than they need, and would thus want to lend out the excess to make a profit. Something of the sort did happen in 1924, although the decline in Bills Discounted is greater than the increase in Treasury Securities, so there is a little more to it than that.
November 25, 2012: The Federal Reserve in the 1920s 2: Interest Rates
Toward the end of 1924, it looks like these Treasury bond buys were a little too aggressive, and people began to take their banknotes to the banks to be redeemed in gold. The Fed reacted by selling Treasury bonds, and the gold outflow stopped. These were all rather subtle movements I would say, basically irrelevant in the larger picture, particularly as total base money didn’t really change much if at all.
The next event of some note is in 1928. It seems to begin with a little rise in Treasury Securities and consequently total “Fed Credit”, which leads to a reduction in gold bullion apparently due to redemption. Treasury securities are sold, apparently in response to the gold outflow, but one consequence is a rise in overnight rates in 1928. The result is that overnight rates are well above the Fed’s discount rate, leading to an increase in Bills Discounted and overall Fed Credit. The problem is remedied by a number of increases in the Fed’s discount rate. Bills Discounted levels off, and the gold outflows stop. The result is that overall Base Money is very flat during this time.
The increase in overnight lending rates in 1928-1929 was related to the stock market boom. At the time, it was quite common to use very aggressive margin for stock purchases, even up to ten times leverage. This margin was financed by overnight borrowing, as noted before, mostly by brokers in the form of Stock Exchange Loans. The increasing rates denotes a very high demand for funds from brokers to fund stock margin lending. The high rate also probably reflects the increasing perception of risk from the lenders, mostly banks. Long term rates were essentially unchanged during this period.
This discussion might seem rather arcane, so let’s summarize some conclusions. What we see here is a hybrid system that includes gold bullion monetization/redemption, and also regular transactions in forms of credit including direct lending, transactions in commercial bills, and transactions in Treasury securities. The Fed maintained a constant presence in the lending market, carrying a balance of Bills Discounted (i.e., lending), which was in turn related to the Fed’s discount rate and its relationship to short-term market rates. Also, the Fed bought and sold Treasury securities (and Bills Purchased) based on its own discretion, adjusting to the conditions of the time, which also had an effect on overnight rates and thus Bills Discounted. All of this added up to the Fed Credit portion of the balance sheet — and the corresponding amount of base money created by these means. The Fed Credit portion goes up and down, although for the most part these moves are minor in the overall scheme.
Total Base Money is rather smooth during the period. This reflects the demand for base money, within the context of a gold standard system, which automatically adjusts the supply to meet the demand such that a stable gold parity value is achieved. This was apparently accomplished by the gold bullion monetization/redemption function, such that any surplus or deficiency of base money from the Fed Credit functions was automatically corrected, producing the smooth curve of Base Money as noted.
This might seem rather confusing, but it was the way things were generally done in those days — not only by the Fed, but also by other major central banks like the Bank of England and also the thousands of note-issuing commercial banks that were part of the National Bank System. From this you can get an idea of why the Bank of England’s discount rate became the primary locus of attention regarding the BoE’s gold standard operational policy. If the Bank of England’s discount rate was well above the market overnight rate, the BoE’s lending would contract, and thus pound base money would also contract (a result that would likely lead to increased gold inflows/monetization to compensate). This would support the currency. If the Bank of England’s discount rate was such that BoE borrowing became more attractive than other alternatives, the BoE’s lending would expand and base money would expand. In the BoE’s case, this too was accompanied by the gold bullion monetization/redemption function, and also transactions in British government bonds.
